
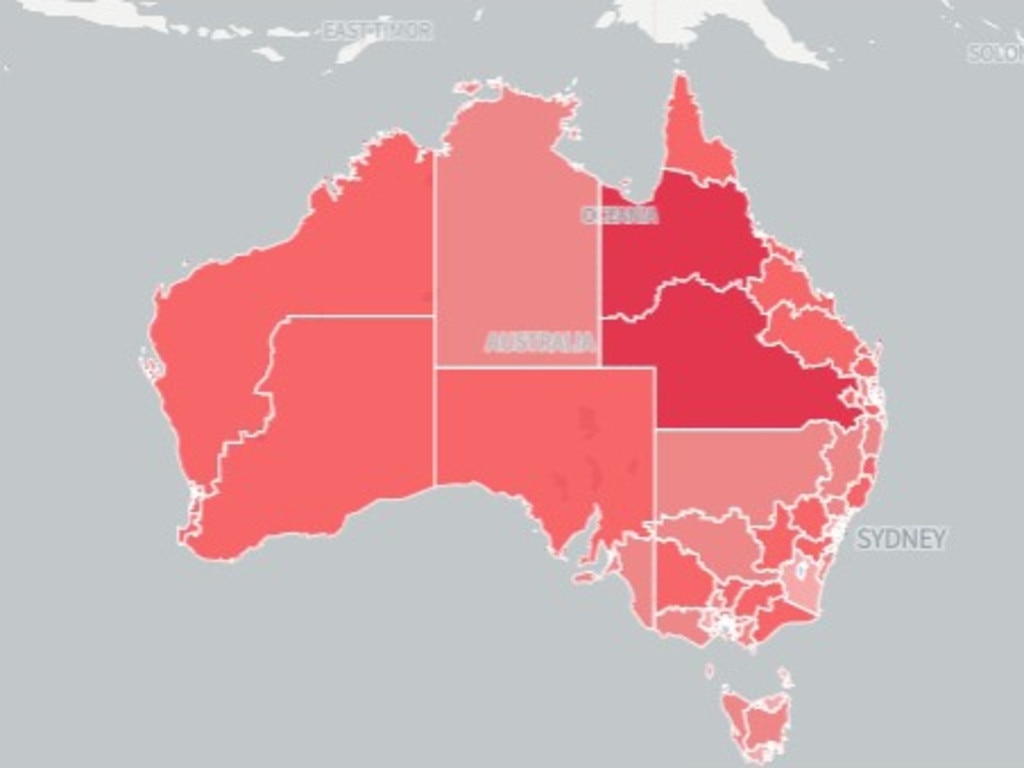
How every Australian electorate was predicted to vote
Forecasting by a UK firm came impressively close to predicting the outcome of yesterday’s referendum. See how their predictions matched up to the results in your electorate.
Analysis by a UK firm has come impressively close to accurately predicting the outcome of yesterday’s referendum on an Indigenous Voice to Parliament.
According to the analysis by focaldata, just 22 electorates out of 151 across Australia were predicted to vote Yes to the referendum on Saturday.
As counting continues, the actual number of electorates to vote Yes stands at 32.
For the voice referendum to pass, it needed a majority across Australia, and four of the six states to also have a majority of Yes votes.
As it happened, the ACT was the only jurisdiction in Australia to embrace the proposal
The analysis predicted that the “no” vote could pick up as much as 61 per cent of the vote versus 39 per cent “yes”, greater than the most recent Newspoll, which put the split at 66 to 34 per cent.
That prediction proved to be eerily precise, with the AEC showing the national majority currently at 60.25 per cent “No” and 39.75 per cent “Yes”.
Focaldata also made predictions on the state and territory electorates where the Yes and No votes were most likely to be strongest and weakest.
Those predictions also proved to be generally accurate, although in many cases the number of people predicted to vote either Yes or No was underestimated or overestimated by a matter of a few percentage points.
In NSW, only a handful of inner city and suburban seats were expected to vote “yes”, while in Queensland, which was expected to come in heavily against the referendum, only the inner-city seats were expected to vote “yes”.
Opposition in regional Queensland was among the strongest anywhere in the country.
In South Australia, there was support for Yes in Adelaide, but it fell quickly outside the inner suburban seats.
A similar story was told in Victoria, where Melburnians in the seat of Melbourne were expected to overwhelming endorse the Voice by 64 per cent but support dropped off rapidly outside the city.
See focaldata’s predictions below, then follow the links to see how people in your state or territory actually voted.
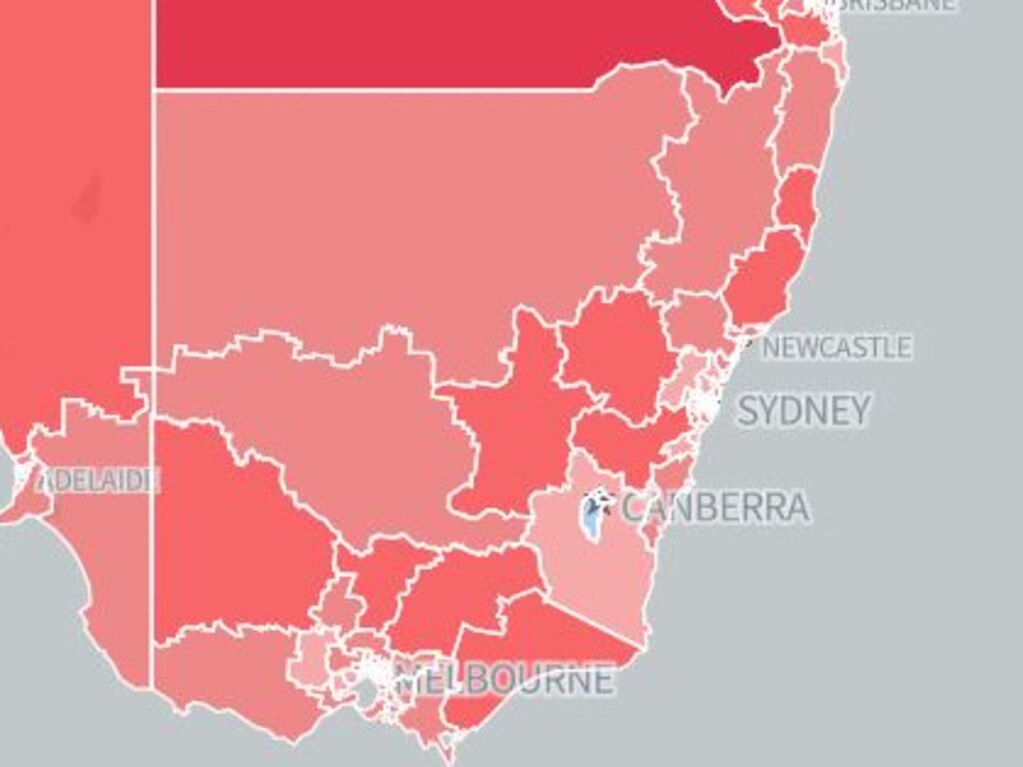
NSW/ACT
Top three Yes electorates - predictions
Sydney - 70.4 per cent (actual: 71.03)
Grayndler - 64.5 per cent (actual: 74.47)
Canberra - 61.9 per cent (actual: 70.46)
Top three No electorates - predictions
Calare - 72.3 per cent (actual: 71.79)
Lyne - 72.2 per cent (67.58)
Cowper - 71.9 per cent (66.55)
Find out how your NSW/ACT electorate was predicted to vote
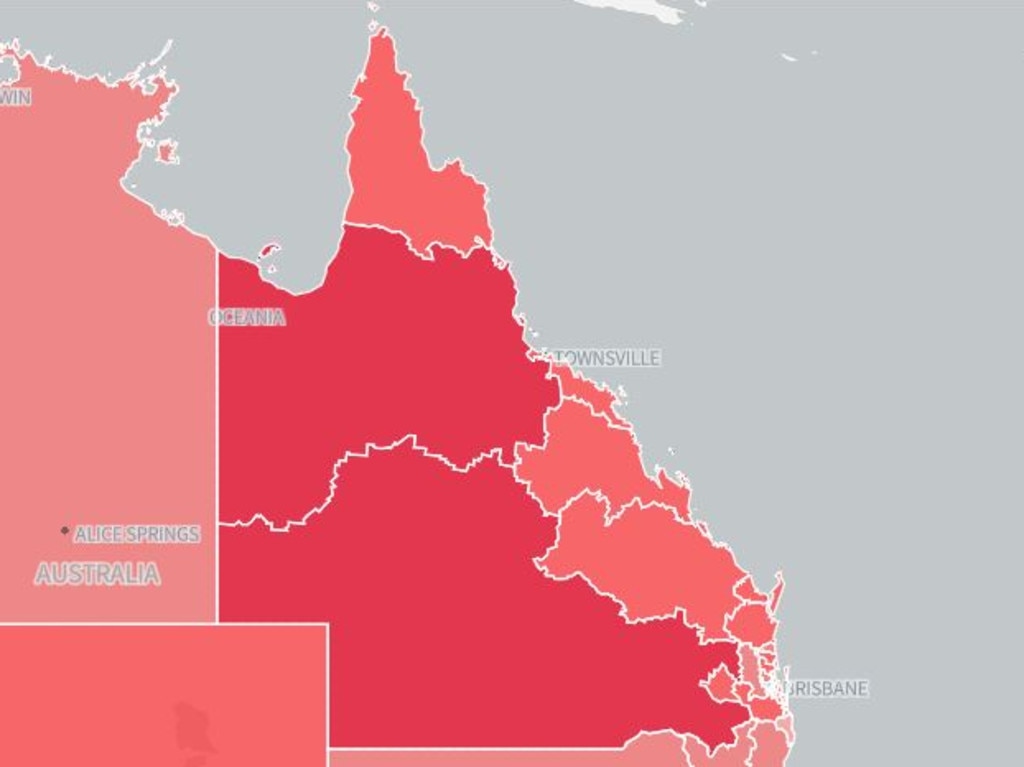
Queensland
Top three Yes electorates - predictions
Brisbane - 57.2 per cent (actual 56.68)
Griffith - 52.6 per cent (actual 56.59)
Ryan - 50.6 per cent (actual 52.69)
Top three No electorates - predictions
Kennedy - 84.9 per cent (actual 80.76)
Maranoa - 81.5 per cent (actual 84.12)
Wide Bay 77.5 per cent (actual 75.20)
Find out how your Queensland electorate was predicted to vote
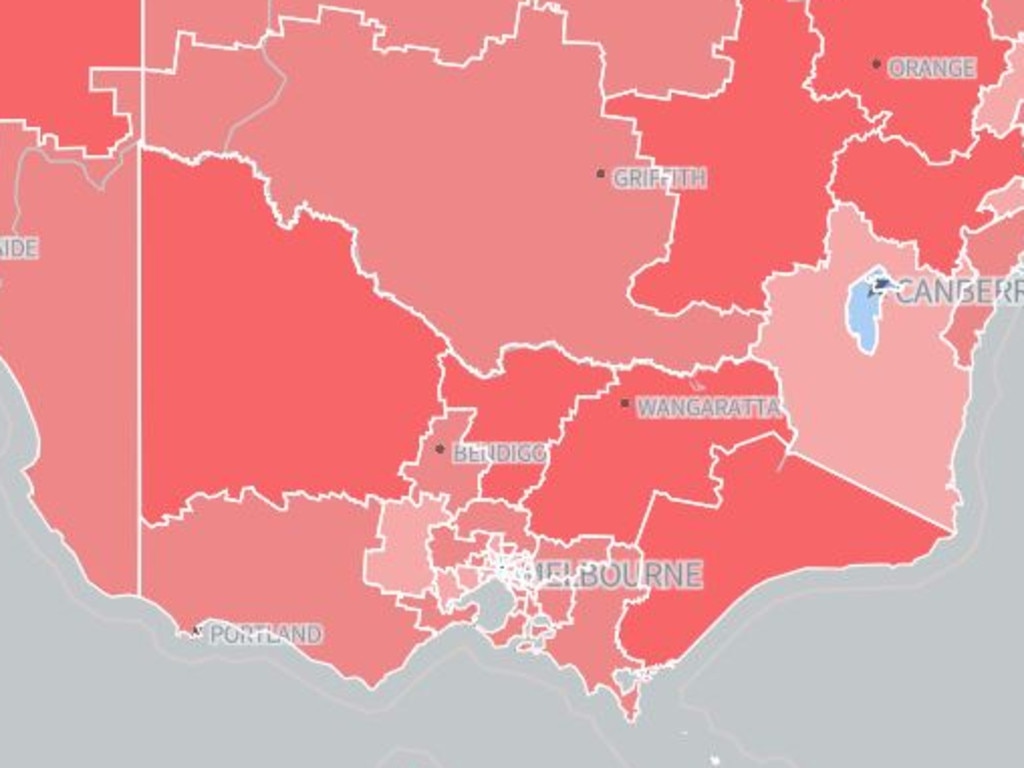
Victoria
Top three Yes electorates - predictions
Melbourne - 64 per cent (actual 78.05)
Macnamara - 56.8 per cent (actual 65.15)
Wills - 52 per cent (actual 64.99)
Top three No electorates - predictions
Mallee - 77.1 per cent (actual 78.53)
Nicholls - 74.2 per cent (actual 76.19)
Gippsland - 73.5 per cent (actual 73.07)
Find out how your Victorian electorate was predicted to vote
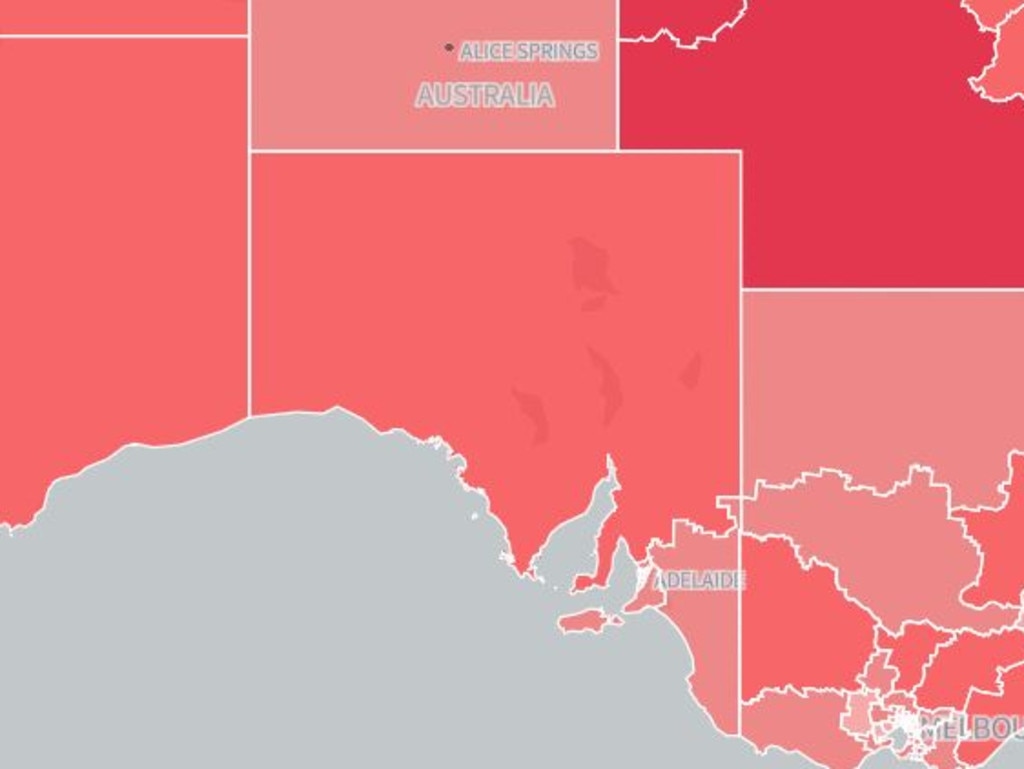
South Australia
Top three Yes electorates - predictions
Adelaide - 59.9 per cent (actual 49.57)
Hindmarsh - 49.7 per cent (actual 38.38)
Boothby - 49 per cent (actual 48.13)
Top three No electorates - predictions
Grey - 71.1 per cent (acual 79.67)
Barker - 69.9 per cent (actual 77.51)
Mayo - 61.5 per cent (actual 59.98)
Find out how your South Australian electorate were predicted to vote
Northern Territory/Western Australia/Tasmania
Top three Yes electorates - predictions
Clark (Tas) - 56.5 per cent (actual 58.03)
Perth (WA) - 52.9 per cent (actual 56.36)
Franklin (Tas) - 45.9 per cent (actual 50.51)
Top three No electorates - -predictions
O’Connor (WA) - 75.7 per cent (actual 75.94)
Canning (WA) - 74.3 per cent (actual 76.89)
Forrest (WA) - 73.1 per cent (actual 68.29)
Find out how electorates in WA, Tasmania and NT were predicted to vote
Originally published as How every Australian electorate was predicted to vote

Demand over Albo’s US beef ban backflip
The Coalition has called for a probe after Labor reversed the partial ban on US beef imports, with David Littleproud pointing fingers at the “concerning” timing.

Albanese’s shock Gaza pic response
The distressing image of the 18-month-old’s skeletal frame has prompted world leaders to react with horror and demand action, including Anthony Albanese.

Political duo share surprise baby news
Josh Burns and Georgie Purcell have announced they were expecting a “vegan” baby due in the first days of 2026.