Ranked: How every Toowoomba school performed in NAPLAN
Here are all the top performing NAPLAN schools in Toowoomba.
News
Don't miss out on the headlines from News. Followed categories will be added to My News.
A leader in education from Toowoomba’s best performing school in NAPLAN has revealed the three factors which are key to the success of students.
Fairholme College is the top performing NAPLAN schools in Toowoomba.
An independent analysis of five years of NAPLAN results has revealed the schools which consistently performed the best in the Year 5 and Year 9 tests between 2017 and 2021.
Over that five-year period, Fairholme College, in Toowoomba, had higher Year 5 yearly results than any other school in the Toowoomba, scoring an average of 2690.0 each year.
Toowoomba Anglican School in Toowoomba was the second best for the region with an average score of 2649.5, while The Glennie School in Toowoomba was the third best with an average score of 2643.5.
The top performing Year 9 school was Fairholme College, in Toowoomba, where the average yearly result was 3083.0 over the five years.
The Glennie School in Toowoomba was the second best for the region with an average score of 3031.0, while Concordia Lutheran College in Toowoomba was the third best with an average score of 2977.3.
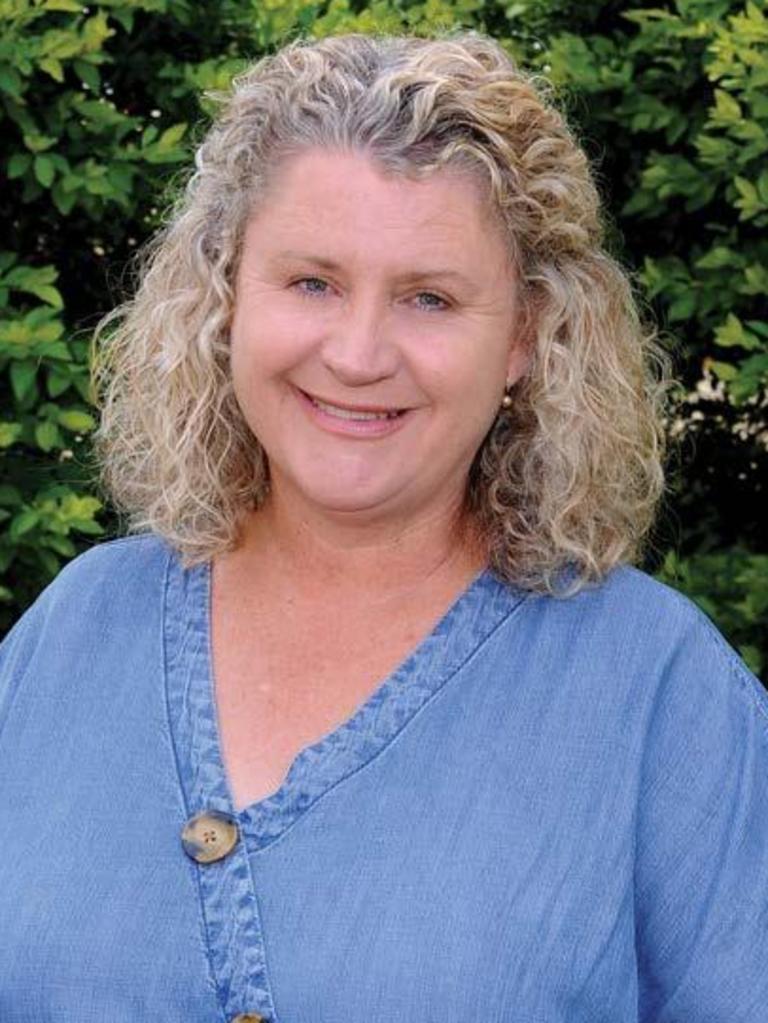
Fairholme College head of junior school Erin Tonscheck said she was in the fortunate position of being at a school with only one to two classes of year 5s each year.
She said this allowed students to be more settled in school and teachers to focus on learning areas where more support was required.

“Teaching students in a way they learn best, having good relationships between students and teachers and using data purposefully to make sure we’re targeting areas are the magic trio,” Ms Tonscheck said.
“By having a smaller cohort, it allows teachers to build strong foundations with our students to make them feel comfortable, safe and a little fearless in their learning spaces.”
Ms Tonscheck said the strategy moving forward would be to continue placing a high value on quality teaching, encouraging students and reflecting on what the data was saying.
“Each girl’s journey is her own and our girls are more than just numbers on a page to us,” she said.
“The results were a pleasant surprise and a great testament to the relationships we have with students, parents and teachers and I’m very grateful for them.”
To determine how each school performed between 2017 and 2021, their average scores for each year were combined and the yearly average found.
Special schools, schools with fewer than 20 students enrolled in either year, and schools that did not report any results for NAPLAN subjects in either year were excluded from the analysis.
The figures were independently compiled from the Federal Government’s MySchool website.


