
Gold Digger: After breaking US$3000/oz, gold could still move higher
Metals Focus analysts have weighed up the potential for gold to move even higher after breaking the US$3000/oz barrier.
Stockhead
Don't miss out on the headlines from Stockhead. Followed categories will be added to My News.
Gold hit a record of over US$3050/oz this week
With uncertainty around war and trade, prices could climb even higher
Besra Gold and North Stawell Minerals among week's biggest gold gainers
Silver longs are at six-month highs and gold is continuing its march beyond records.
And as traders get more defensive than Rahul Dravid on a sharply turning sub-continental deck, expect strength to remain if the latest analysis from Metals Focus is anything to go by.
Its latest market analysis comes at a pivotal point for bullion and its poor cousin silver, with the former at all-time highs of over US$3050/oz following an optimistic response to a US Fed rate pause on Wednesday.
Up 15% YTD, gold fever hasn't quite been matched by silver, but Metals Focus has pointed out that net longs reported by the CME are up to 210Moz, levels not seen since October.
The drivers are familiar to Gold Digger readers – central bank buying, the start of an interest rate cutting cycle and concerns over the general state of the world and its economy.
Volatility is being heightened by the unconventional economic policies of Team Trump over in the US, where April 2 looms as a key date when reciprocal tariffs against its trading partners are expected to be introduced.
"Looking at these drivers in detail, the Trump administration’s economic policies have played an increasingly important role in impacting global sentiment since November. As the months progressed, tariffs on key trading partners and counter-tariffs on the US have raised the spectre of a prolonged trade war," Metals Focus analysts said.
"Financial markets initially expected tariffs to be inflationary and so re-priced accordingly, basis a slower pace of rate cuts by the Fed. These were soon outweighed by concerns over economic growth.
"Importantly, worries about an outright US recession have grown in recent months and have translated into higher demand for defensive assets such as gold."
Gold goes inverse
Historically gold has held a number of inverse relationships, notably to both treasury bond yields and the US dollar.
But its latest break with recent trends has been a sharp twist in the performance of the yellow metal and US equities, until recently the darlings of the investment world.
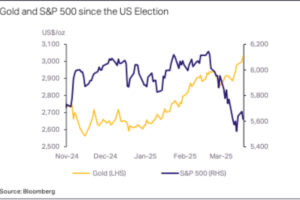
Metals Focus says against the backdrop of trade uncertainty and a weaker US dollar, along with the end of a ceasefire in Gaza, has seen the S&P 500 fall 10% from its February high, with investors moving according to a Bank of America survey from 17% overweight on US stocks to 23% net underweight in March.
"By contrast, gold has continued to attract inflows. This is evidenced by a net rise of 100t in gold ETPs in February, the highest monthly inflow since March 2022. Providing further support to gold, central bank buying has also remained healthy," MF said.
"After another year of exceptionally strong buying in 2024, regular buyers, such as China, India and Poland have reported further gains so far in 2025."
Does this continue?
Metals Focus says against the current landscape another market correction can't be ruled out.
"Against this backdrop, investment inflows into gold are likely to continue among institutional investors seeking portfolio diversifications in the coming weeks."
But its analysts do see gold's investment case becoming less attractive in the back end of the year, on the premise markets will get more clarity on the impact of tariffs.
"Once investment inflows into gold slow, this should start to create downward pressure for the gold price," they said.
"Even so, the Trump administration’s fast-changing policies will see financial market volatility remain high. Strong purchases by the official sector are also projected to persist in the foreseeable future. All these should keep gold prices elevated throughout this year."
Winners & Losers
Here’s how ASX-listed precious metals stocks are performing:
| CODE | COMPANY | PRICE | WEEK % | MONTH % | 6 MONTH % | YEAR % | YTD % | MARKET CAP |
|---|---|---|---|---|---|---|---|---|
| MRR | Minrex Resources Ltd | 0.008 | 14% | 0% | -16% | -43% | 14% | $ 8,678,940.02 |
| NPM | Newpeak Metals | 0.014 | -7% | -13% | -18% | 57% | 27% | $ 4,831,075.97 |
| ASO | Aston Minerals Ltd | 0.02 | 11% | 11% | 54% | 33% | 122% | $ 24,606,221.11 |
| MTC | Metalstech Ltd | 0.11 | 0% | -8% | -35% | -35% | -21% | $ 21,729,343.13 |
| GED | Golden Deeps | 0.021 | -5% | -9% | -45% | -54% | -16% | $ 3,234,469.33 |
| G88 | Golden Mile Res Ltd | 0.009 | 0% | -10% | 0% | -18% | 0% | $ 4,898,230.70 |
| LAT | Latitude 66 Limited | 0.065 | 8% | -2% | -41% | -68% | 71% | $ 9,321,045.83 |
| NMR | Native Mineral Res | 0.077 | 17% | 20% | 267% | 285% | 97% | $ 59,290,475.78 |
| AQX | Alice Queen Ltd | 0.006 | -8% | -33% | -25% | 0% | -25% | $ 6,881,340.41 |
| SLZ | Sultan Resources Ltd | 0.007 | 0% | -22% | 17% | -42% | 17% | $ 1,620,289.37 |
| KSN | Kingston Resources | 0.083 | 5% | -1% | 2% | 8% | 17% | $ 69,044,211.85 |
| AMI | Aurelia Metals Ltd | 0.2475 | 8% | 15% | 41% | 71% | 46% | $ 431,606,023.20 |
| GIB | Gibb River Diamonds | 0.042 | 0% | 17% | -2% | 68% | 5% | $ 9,009,396.69 |
| KCN | Kingsgate Consolid. | 1.47 | 1% | 9% | 17% | 22% | 14% | $ 384,050,021.08 |
| TMX | Terrain Minerals | 0.0045 | 13% | 0% | 50% | 0% | 50% | $ 8,014,226.40 |
| BNR | Bulletin Res Ltd | 0.042 | 5% | 5% | -2% | -35% | 8% | $ 12,331,759.57 |
| NXM | Nexus Minerals Ltd | 0.073 | 30% | 11% | 62% | 55% | 62% | $ 35,625,836.68 |
| SKY | SKY Metals Ltd | 0.049 | 0% | -6% | 21% | 48% | -9% | $ 36,245,861.47 |
| LM8 | Lunnonmetalslimited | 0.22 | 10% | -2% | 47% | -17% | -12% | $ 46,331,916.54 |
| CST | Castile Resources | 0.077 | 26% | 8% | 1% | 20% | -4% | $ 23,236,892.08 |
| YRL | Yandal Resources | 0.15 | 7% | -25% | 25% | 67% | -14% | $ 46,385,247.30 |
| FAU | First Au Ltd | 0.0025 | 0% | 0% | 67% | 25% | 25% | $ 5,179,983.19 |
| ARL | Ardea Resources Ltd | 0.41 | -8% | -9% | 3% | -43% | 24% | $ 82,868,409.73 |
| GWR | GWR Group Ltd | 0.092 | 5% | -3% | 14% | -12% | 15% | $ 29,551,932.26 |
| IVR | Investigator Res Ltd | 0.023 | 10% | -8% | -39% | -43% | 15% | $ 38,133,109.78 |
| GTR | Gti Energy Ltd | 0.003 | 50% | 0% | -25% | -60% | -14% | $ 8,996,848.99 |
| IPT | Impact Minerals | 0.006 | -14% | -36% | -47% | -58% | -36% | $ 18,583,246.55 |
| BNZ | Benzmining | 0.39 | -3% | -10% | 136% | 144% | 13% | $ 50,386,363.56 |
| MOH | Moho Resources | 0.004 | -20% | 0% | -33% | -33% | -20% | $ 2,923,498.30 |
| BCM | Brazilian Critical | 0.008 | -11% | 0% | -38% | -65% | -11% | $ 9,566,627.29 |
| PUA | Peak Minerals Ltd | 0.009 | 0% | -16% | 364% | 273% | 16% | $ 28,073,212.90 |
| MRZ | Mont Royal Resources | 0.041 | 0% | 0% | -21% | -38% | -5% | $ 3,486,221.51 |
| SMS | Starmineralslimited | 0.027 | -10% | -13% | -41% | -17% | -25% | $ 4,098,779.63 |
| MVL | Marvel Gold Limited | 0.012 | 20% | 20% | 9% | 9% | 33% | $ 9,501,697.73 |
| PRX | Prodigy Gold NL | 0.002 | 0% | 0% | 0% | -44% | 0% | $ 6,350,111.10 |
| AAU | Antilles Gold Ltd | 0.0045 | -10% | -10% | 50% | -78% | 50% | $ 9,541,692.26 |
| CWX | Carawine Resources | 0.099 | -6% | -1% | 5% | -6% | -1% | $ 24,793,172.15 |
| RND | Rand Mining Ltd | 1.65 | 0% | -3% | -3% | 20% | 9% | $ 93,845,335.65 |
| CAZ | Cazaly Resources | 0.015 | 15% | -6% | 7% | -17% | 7% | $ 6,458,241.87 |
| BMR | Ballymore Resources | 0.135 | 17% | 13% | -7% | 8% | 13% | $ 23,858,628.98 |
| DRE | Dreadnought Resources Ltd | 0.0155 | 11% | 19% | -3% | -9% | 29% | $ 66,547,200.00 |
| ZNC | Zenith Minerals Ltd | 0.051 | 13% | 21% | 19% | -46% | 28% | $ 20,779,512.52 |
| REZ | Resourc & En Grp Ltd | 0.022 | 0% | -19% | -12% | 144% | -4% | $ 14,776,060.68 |
| LEX | Lefroy Exploration | 0.092 | 8% | 15% | 28% | -16% | 31% | $ 22,854,652.70 |
| ERM | Emmerson Resources | 0.14 | 17% | 27% | 180% | 175% | 82% | $ 82,630,454.27 |
| AM7 | Arcadia Minerals | 0.02 | 0% | -13% | -41% | -71% | 5% | $ 2,347,668.66 |
| ADT | Adriatic Metals | 4.44 | -1% | 4% | 35% | 19% | 14% | $ 1,372,980,085.12 |
| AS1 | Asara Resources Ltd | 0.035 | 6% | 13% | 119% | 289% | 84% | $ 37,440,046.83 |
| CYL | Catalyst Metals | 4.6 | 4% | 11% | 78% | 636% | 78% | $ 1,039,607,102.40 |
| CHN | Chalice Mining Ltd | 1.3825 | 4% | -6% | 0% | 25% | 25% | $ 566,033,976.54 |
| KAL | Kalgoorliegoldmining | 0.063 | -2% | -11% | 163% | 152% | 250% | $ 23,492,473.77 |
| MLS | Metals Australia | 0.02 | 0% | -5% | -23% | -13% | -13% | $ 14,574,390.48 |
| ADN | Andromeda Metals Ltd | 0.008 | 14% | 14% | 14% | -64% | 14% | $ 24,001,093.82 |
| MEI | Meteoric Resources | 0.0715 | 8% | 4% | -28% | -70% | -16% | $ 170,411,845.87 |
| SRN | Surefire Rescs NL | 0.003 | 0% | -14% | -57% | -73% | -14% | $ 7,248,923.44 |
| WA8 | Warriedarresourltd | 0.059 | 31% | 18% | 2% | 20% | 34% | $ 61,163,648.58 |
| HMX | Hammer Metals Ltd | 0.03 | 3% | 0% | -21% | -19% | -9% | $ 27,520,519.70 |
| WCN | White Cliff Min Ltd | 0.018 | 13% | -5% | -5% | 29% | 13% | $ 34,118,473.46 |
| AVM | Advance Metals Ltd | 0.047 | 7% | 0% | 124% | 31% | 38% | $ 9,749,950.42 |
| ASR | Asra Minerals Ltd | 0.004 | 33% | 33% | -27% | -20% | 33% | $ 7,119,380.49 |
| ARI | Arika Resources | 0.023 | 5% | -44% | -12% | -8% | -15% | $ 13,303,681.40 |
| CTO | Citigold Corp Ltd | 0.004 | 0% | 0% | 0% | -11% | 0% | $ 12,000,000.00 |
| SMI | Santana Minerals Ltd | 0.565 | 3% | -6% | -20% | 38% | 16% | $ 426,404,018.25 |
| M2R | Miramar | 0.004 | 33% | 0% | -50% | -78% | 33% | $ 1,825,387.11 |
| MHC | Manhattan Corp Ltd | 0.018 | 0% | -5% | -10% | -64% | -5% | $ 4,228,180.16 |
| GRL | Godolphin Resources | 0.013 | 8% | -24% | -19% | -59% | -10% | $ 5,027,381.10 |
| SVG | Savannah Goldfields | 0.015 | 0% | -32% | -31% | -41% | -18% | $ 8,982,078.55 |
| EMC | Everest Metals Corp | 0.165 | 3% | 0% | 38% | 109% | 22% | $ 38,043,252.12 |
| GUL | Gullewa Limited | 0.055 | -15% | 6% | -15% | 0% | -2% | $ 11,991,219.46 |
| CY5 | Cygnus Metals Ltd | 0.115 | 10% | -15% | 53% | 113% | 15% | $ 101,907,800.52 |
| G50 | G50Corp Ltd | 0.155 | 24% | 7% | 7% | 55% | 0% | $ 24,892,637.15 |
| ADV | Ardiden Ltd | 0.135 | -7% | -13% | 0% | -10% | 0% | $ 8,752,450.84 |
| AAR | Astral Resources NL | 0.155 | 7% | 3% | 41% | 154% | 15% | $ 218,994,494.40 |
| VMC | Venus Metals Cor Ltd | 0.11 | 0% | 24% | 83% | 28% | 64% | $ 23,535,441.96 |
| NAE | New Age Exploration | 0.004 | 0% | -20% | 0% | 0% | 14% | $ 11,562,295.10 |
| VKA | Viking Mines Ltd | 0.008 | -11% | 0% | -11% | -27% | 0% | $ 11,953,325.88 |
| LCL | LCL Resources Ltd | 0.007 | -13% | -30% | -36% | -42% | -30% | $ 8,363,688.95 |
| MTH | Mithril Silver Gold | 0.39 | 7% | 5% | 5% | 95% | -3% | $ 58,265,408.80 |
| ADG | Adelong Gold Limited | 0.005 | 0% | -17% | 25% | 25% | 11% | $ 7,686,174.09 |
| RMX | Red Mount Min Ltd | 0.0085 | 6% | 6% | -15% | -51% | -6% | $ 4,184,620.16 |
| PRS | Prospech Limited | 0.023 | -8% | -8% | -39% | -34% | -21% | $ 7,562,995.40 |
| TTM | Titan Minerals | 0.415 | 6% | -16% | -8% | 43% | 9% | $ 107,937,483.22 |
| AKA | Aureka Limited | 0.155 | 0% | -11% | -98% | -98% | 15% | $ 15,877,408.88 |
| AAM | Aumegametals | 0.045 | 7% | -4% | 2% | 8% | 7% | $ 27,789,199.93 |
| KZR | Kalamazoo Resources | 0.088 | 16% | 11% | 11% | 1% | 19% | $ 16,960,874.88 |
| BCN | Beacon Minerals | 0.027 | 8% | 4% | 23% | 13% | 23% | $ 109,885,468.99 |
| MAU | Magnetic Resources | 1.505 | -2% | 11% | 9% | 45% | 36% | $ 401,475,530.75 |
| BC8 | Black Cat Syndicate | 0.84 | -2% | 0% | 127% | 320% | 49% | $ 502,816,225.80 |
| EM2 | Eagle Mountain | 0.005 | -29% | -38% | -87% | -91% | -44% | $ 5,675,186.45 |
| EMR | Emerald Res NL | 3.95 | -1% | -3% | 1% | 42% | 22% | $ 2,733,308,888.96 |
| BYH | Bryah Resources Ltd | 0.004 | -20% | 0% | -20% | -60% | 33% | $ 2,507,202.91 |
| HCH | Hot Chili Ltd | 0.685 | 1% | -11% | -14% | -38% | -2% | $ 103,085,381.32 |
| WAF | West African Res Ltd | 2.27 | 6% | 30% | 34% | 123% | 58% | $ 2,621,486,741.20 |
| MEU | Marmota Limited | 0.046 | 2% | -13% | 28% | 2% | 18% | $ 55,380,372.13 |
| NVA | Nova Minerals Ltd | 0.3275 | 6% | -1% | 105% | 24% | -11% | $ 104,642,660.53 |
| SVL | Silver Mines Limited | 0.096 | 8% | 8% | 3% | -36% | 23% | $ 186,876,416.16 |
| PGD | Peregrine Gold | 0.15 | 30% | 7% | 0% | -32% | 7% | $ 11,919,595.50 |
| ICL | Iceni Gold | 0.081 | 8% | -10% | 131% | 252% | 14% | $ 24,322,952.84 |
| FG1 | Flynngold | 0.024 | 9% | -11% | -14% | -39% | -4% | $ 7,066,867.94 |
| WWI | West Wits Mining Ltd | 0.019 | 19% | -5% | 12% | 36% | 36% | $ 49,877,217.74 |
| RML | Resolution Minerals | 0.009 | -18% | 0% | -44% | -63% | -25% | $ 4,651,679.66 |
| AAJ | Aruma Resources Ltd | 0.014 | 27% | 33% | -18% | -22% | 17% | $ 2,886,756.24 |
| HWK | Hawk Resources. | 0.023 | 5% | -4% | -23% | -48% | 5% | $ 6,231,377.33 |
| GMN | Gold Mountain Ltd | 0.0025 | 25% | 25% | -17% | -17% | -17% | $ 4,579,223.18 |
| MEG | Megado Minerals Ltd | 0.015 | 25% | 15% | -17% | 43% | -12% | $ 5,875,565.67 |
| HMG | Hamelingoldlimited | 0.078 | 18% | 26% | 22% | 5% | 22% | $ 12,331,800.00 |
| BM8 | Battery Age Minerals | 0.06 | -6% | -21% | -48% | -43% | -43% | $ 7,147,850.82 |
| TBR | Tribune Res Ltd | 4.67 | -1% | -6% | 5% | 27% | 9% | $ 248,698,684.98 |
| FML | Focus Minerals Ltd | 0.21 | 2% | 8% | 56% | 17% | 24% | $ 60,177,315.45 |
| VRC | Volt Resources Ltd | 0.0045 | 13% | 50% | 13% | -10% | 50% | $ 18,117,573.47 |
| ARV | Artemis Resources | 0.008 | 0% | -20% | -33% | -58% | 0% | $ 20,228,234.46 |
| HRN | Horizon Gold Ltd | 0.42 | 2% | -8% | 24% | 45% | -13% | $ 60,108,568.05 |
| CLA | Celsius Resource Ltd | 0.007 | -13% | -36% | -42% | -50% | -36% | $ 23,052,575.90 |
| QML | Qmines Limited | 0.0455 | 3% | -11% | -52% | -33% | -16% | $ 18,871,726.98 |
| RDN | Raiden Resources Ltd | 0.005 | -9% | -17% | -87% | -81% | -55% | $ 17,254,457.21 |
| TCG | Turaco Gold Limited | 0.35 | 11% | -3% | 19% | 112% | 37% | $ 311,788,697.40 |
| KCC | Kincora Copper | 0.025 | 0% | -11% | -47% | -19% | -7% | $ 6,025,392.98 |
| GBZ | GBM Rsources Ltd | 0.008 | 0% | 0% | 0% | -11% | 0% | $ 9,368,559.82 |
| DTM | Dart Mining NL | 0.005 | 0% | -17% | -67% | -68% | -44% | $ 3,438,819.57 |
| MKR | Manuka Resources. | 0.032 | 19% | 14% | -14% | -58% | 14% | $ 25,944,565.41 |
| AUC | Ausgold Limited | 0.535 | 1% | 14% | 24% | 73% | 27% | $ 194,355,067.09 |
| ANX | Anax Metals Ltd | 0.009 | 13% | -10% | -55% | -63% | -25% | $ 7,945,268.10 |
| EMU | EMU NL | 0.029 | -15% | -15% | 21% | 5% | 7% | $ 5,614,440.86 |
| SFM | Santa Fe Minerals | 0.041 | 0% | 11% | 8% | -9% | 32% | $ 2,985,570.35 |
| SSR | SSR Mining Inc. | 17.33 | 9% | 7% | 103% | 189% | 59% | $ 61,615,915.20 |
| PNR | Pantoro Limited | 0.16 | 7% | 14% | 33% | 186% | 78% | $ 1,086,410,097.47 |
| CMM | Capricorn Metals | 8.2 | 5% | 3% | 29% | 71% | 31% | $ 3,536,310,458.90 |
| X64 | Ten Sixty Four Ltd | 0 | -100% | -100% | -100% | -100% | -100% | $ 129,844,903.32 |
| VRL | Verity Resources | 0.013 | 0% | -13% | -57% | -81% | -35% | $ 2,396,427.29 |
| HAW | Hawthorn Resources | 0.043 | 0% | -2% | -23% | -39% | 5% | $ 14,405,671.36 |
| BGD | Bartongoldholdings | 0.315 | 0% | 2% | 29% | 13% | 29% | $ 70,042,600.64 |
| SVY | Stavely Minerals Ltd | 0.017 | 3% | -19% | -37% | -48% | 0% | $ 9,248,715.58 |
| AGC | AGC Ltd | 0.195 | 15% | 18% | -17% | 171% | 26% | $ 46,187,499.96 |
| RGL | Riversgold | 0.004 | -11% | -20% | -20% | -47% | 0% | $ 7,576,706.67 |
| TSO | Tesoro Gold Ltd | 0.032 | 19% | -3% | 3% | 7% | 60% | $ 48,155,835.27 |
| GUE | Global Uranium | 0.066 | 3% | -14% | 18% | -34% | 10% | $ 19,451,486.60 |
| CPM | Coopermetalslimited | 0.038 | -5% | -21% | -36% | -71% | -17% | $ 3,055,870.35 |
| MM8 | Medallion Metals. | 0.19 | 27% | 23% | 239% | 239% | 58% | $ 85,587,816.06 |
| FFM | Firefly Metals Ltd | 1.0525 | 8% | 7% | -3% | 63% | 14% | $ 609,840,275.76 |
| CBY | Canterbury Resources | 0.024 | 14% | -4% | -29% | -27% | 9% | $ 4,738,581.50 |
| SLA | Solara Minerals | 0.115 | -8% | -18% | -64% | -34% | 28% | $ 7,248,102.88 |
| SFR | Sandfire Resources | 11.48 | 7% | 6% | 26% | 35% | 24% | $ 5,279,696,771.43 |
| SMG | Silvermetalgroupltd | 0.06 | 0% | 0% | 0% | 0% | 0% | $ 4,881,135.48 |
| TAM | Tanami Gold NL | 0.028 | 2% | 0% | -13% | -15% | -7% | $ 32,902,717.29 |
| NWM | Norwest Minerals | 0.01 | 0% | -26% | -50% | -63% | -29% | $ 4,851,195.10 |
| ALK | Alkane Resources Ltd | 0.635 | 5% | 0% | 43% | 11% | 25% | $ 381,491,391.96 |
| BMO | Bastion Minerals | 0.0035 | -13% | -13% | -42% | -65% | -13% | $ 2,956,536.32 |
| IDA | Indiana Resources | 0.077 | 3% | 5% | 50% | 79% | 26% | $ 49,490,399.27 |
| GSM | Golden State Mining | 0.01 | 25% | 11% | -9% | 0% | 25% | $ 2,514,335.67 |
| NSM | Northstaw | 0.048 | 37% | 66% | 320% | 51% | 200% | $ 12,815,795.50 |
| GSN | Great Southern | 0.024 | 9% | 0% | 41% | 9% | 60% | $ 23,923,302.96 |
| VAU | Vault Minerals Ltd | 0.4575 | 5% | 12% | 41% | 37% | 39% | $ 3,163,150,122.63 |
| DEG | De Grey Mining | 2.13 | 5% | 4% | 59% | 79% | 21% | $ 5,131,642,037.66 |
| THR | Thor Energy PLC | 0.012 | 9% | -8% | -29% | -50% | -8% | $ 9,923,057.69 |
| CDR | Codrus Minerals Ltd | 0.016 | -6% | -11% | -27% | -61% | -6% | $ 2,646,200.06 |
| MDI | Middle Island Res | 0.017 | 13% | -11% | -6% | 21% | 42% | $ 4,684,105.80 |
| WTM | Waratah Minerals Ltd | 0.175 | 9% | -3% | -51% | 136% | 13% | $ 35,417,812.33 |
| POL | Polymetals Resources | 0.825 | 6% | 6% | 206% | 180% | 4% | $ 201,561,856.58 |
| RDS | Redstone Resources | 0.0035 | 17% | 17% | 0% | -13% | 40% | $ 3,238,824.61 |
| NAG | Nagambie Resources | 0.017 | 6% | 6% | -19% | 21% | -6% | $ 12,852,837.50 |
| BGL | Bellevue Gold Ltd | 1.315 | 4% | 10% | 3% | -29% | 17% | $ 1,726,659,676.15 |
| GBR | Greatbould Resources | 0.071 | 1% | 8% | 45% | 18% | 65% | $ 52,377,923.05 |
| KAI | Kairos Minerals Ltd | 0.021 | 17% | -5% | 62% | 62% | 75% | $ 57,880,068.16 |
| KAU | Kaiser Reef | 0.17 | 3% | -3% | 13% | 36% | 6% | $ 44,303,795.20 |
| HRZ | Horizon | 0.067 | 20% | -3% | 52% | 91% | 68% | $ 141,247,250.23 |
| CDT | Castle Minerals | 0.002 | 0% | 0% | -33% | -69% | 0% | $ 3,855,645.76 |
| RSG | Resolute Mining | 0.4475 | 9% | 24% | -38% | 21% | 13% | $ 947,427,255.79 |
| MXR | Maximus Resources | 0.077 | 12% | 15% | 141% | 146% | 33% | $ 33,424,752.21 |
| EVN | Evolution Mining Ltd | 6.835 | 6% | 7% | 55% | 107% | 42% | $ 13,686,678,051.20 |
| CXU | Cauldron Energy Ltd | 0.01 | 25% | -17% | -49% | -73% | -17% | $ 16,075,450.70 |
| DLI | Delta Lithium | 0.17 | 0% | -3% | -19% | -46% | 0% | $ 125,394,813.60 |
| ALY | Alchemy Resource Ltd | 0.007 | 0% | -13% | 0% | -13% | 0% | $ 8,246,533.79 |
| NH3 | Nh3Cleanenergyltd | 0.024 | 20% | 26% | 4% | -4% | 33% | $ 12,091,305.27 |
| OBM | Ora Banda Mining Ltd | 1.03 | -2% | 7% | 63% | 329% | 58% | $ 2,097,113,326.61 |
| AVW | Avira Resources Ltd | 0.008 | 0% | -11% | -60% | -73% | -60% | $ 1,322,457.70 |
| LCY | Legacy Iron Ore | 0.0105 | 5% | -5% | -16% | -22% | 5% | $ 97,620,425.84 |
| PDI | Predictive Disc Ltd | 0.3875 | 14% | 19% | 36% | 68% | 68% | $ 966,504,468.80 |
| MAT | Matsa Resources | 0.058 | 4% | 7% | 53% | 107% | 66% | $ 43,970,496.48 |
| ZAG | Zuleika Gold Ltd | 0.012 | -8% | 0% | -14% | -33% | -8% | $ 8,902,559.12 |
| GML | Gateway Mining | 0.021 | 0% | -5% | -16% | -16% | 0% | $ 8,585,226.20 |
| SBM | St Barbara Limited | 0.225 | 15% | -13% | -24% | 36% | 0% | $ 243,640,426.73 |
| SBR | Sabre Resources | 0.008 | 14% | -11% | -43% | -53% | -20% | $ 3,143,695.46 |
| STK | Strickland Metals | 0.087 | 2% | 28% | -5% | 0% | 2% | $ 198,667,326.78 |
| CEL | Challenger Gold Ltd | 0.063 | 15% | 7% | 9% | -21% | 34% | $ 102,952,120.54 |
| GG8 | Gorilla Gold Mines | 0.4 | 7% | 48% | 111% | 1037% | 54% | $ 224,493,542.40 |
| NST | Northern Star | 18.25 | 5% | 2% | 14% | 36% | 18% | $ 20,953,918,023.59 |
| OZM | Ozaurum Resources | 0.061 | -6% | -45% | 53% | 15% | 103% | $ 12,914,881.76 |
| TG1 | Techgen Metals Ltd | 0.03 | 3% | -17% | -14% | -6% | -14% | $ 4,759,971.30 |
| XAM | Xanadu Mines Ltd | 0.052 | 0% | -2% | -5% | -7% | 6% | $ 99,434,272.91 |
| AQI | Alicanto Min Ltd | 0.032 | 0% | -16% | 39% | 16% | -14% | $ 27,140,575.23 |
| KTA | Krakatoa Resources | 0.009 | 0% | -10% | -18% | 0% | -5% | $ 5,311,206.23 |
| ARN | Aldoro Resources | 0.2975 | -1% | -16% | 267% | 281% | -22% | $ 54,110,716.43 |
| WGX | Westgold Resources. | 2.975 | 13% | 19% | 9% | 24% | 5% | $ 2,782,173,585.50 |
| MBK | Metal Bank Ltd | 0.018 | 6% | 29% | 30% | -21% | 20% | $ 8,954,261.96 |
| A8G | Australasian Metals | 0.075 | 0% | 9% | -32% | 6% | -5% | $ 4,341,729.38 |
| TAR | Taruga Minerals | 0.008 | -11% | -20% | -11% | 0% | -20% | $ 5,648,214.28 |
| DTR | Dateline Resources | 0.0045 | 0% | 50% | -10% | -68% | 29% | $ 10,262,274.48 |
| GOR | Gold Road Res Ltd | 2.39 | -8% | -8% | 44% | 59% | 17% | $ 2,669,493,858.30 |
| S2R | S2 Resources | 0.061 | -5% | -10% | -26% | -51% | -9% | $ 27,171,479.58 |
| NES | Nelson Resources. | 0.003 | 0% | 0% | 0% | -14% | 0% | $ 6,515,782.98 |
| TLM | Talisman Mining | 0.17 | 3% | -8% | -23% | 0% | -17% | $ 33,897,662.82 |
| BEZ | Besragoldinc | 0.054 | 93% | 20% | -30% | -61% | -40% | $ 22,436,403.35 |
| PRU | Perseus Mining Ltd | 3.165 | 1% | 9% | 21% | 58% | 23% | $ 4,377,268,647.51 |
| SPQ | Superior Resources | 0.006 | -14% | 20% | -25% | -39% | 0% | $ 13,019,182.79 |
| PUR | Pursuit Minerals | 0.075 | 3% | 0% | -50% | -67% | -22% | $ 6,192,547.13 |
| RMS | Ramelius Resources | 2.18 | 1% | -17% | 0% | 35% | 5% | $ 2,518,581,524.68 |
| PKO | Peako Limited | 0.003 | 0% | 0% | 0% | -3% | 0% | $ 4,463,225.88 |
| ICG | Inca Minerals Ltd | 0.005 | -17% | -17% | 0% | -17% | 0% | $ 5,133,612.67 |
| A1G | African Gold Ltd. | 0.07 | 15% | -9% | 71% | 135% | 27% | $ 26,337,094.38 |
| NMG | New Murchison Gold | 0.016 | 7% | 45% | 113% | 191% | 78% | $ 132,632,480.80 |
| GNM | Great Northern | 0.014 | -7% | -33% | 17% | -7% | 0% | $ 2,164,807.08 |
| KRM | Kingsrose Mining Ltd | 0.0355 | 1% | 1% | 4% | 15% | 1% | $ 28,634,007.72 |
| BTR | Brightstar Resources | 0.021 | 0% | 0% | 17% | 31% | 5% | $ 228,123,311.40 |
| RRL | Regis Resources | 3.675 | 9% | 20% | 82% | 103% | 44% | $ 2,749,938,951.76 |
| M24 | Mamba Exploration | 0.014 | 0% | 0% | 17% | -44% | 17% | $ 4,132,318.54 |
| TRM | Truscott Mining Corp | 0.073 | 0% | 1% | 4% | 56% | -6% | $ 13,975,744.88 |
| TNC | True North Copper | 0.355 | 6% | -3% | -90% | -95% | -88% | $ 46,560,435.92 |
| MOM | Moab Minerals Ltd | 0.001 | 0% | -50% | -75% | -80% | -50% | $ 3,467,332.06 |
| KNB | Koonenberrygold | 0.037 | 32% | 12% | 311% | 64% | 208% | $ 33,874,349.18 |
| AWJ | Auric Mining | 0.275 | 8% | -8% | -13% | 83% | -19% | $ 40,962,177.03 |
| ENR | Encounter Resources | 0.2325 | 3% | -1% | -45% | -5% | -28% | $ 117,216,194.97 |
| SNG | Siren Gold | 0.055 | 1% | 0% | -24% | 0% | -15% | $ 11,824,412.89 |
| STN | Saturn Metals | 0.27 | 10% | 15% | -4% | 46% | 32% | $ 84,943,343.10 |
| USL | Unico Silver Limited | 0.2325 | 19% | 8% | 8% | 94% | 19% | $ 102,916,782.43 |
| PNM | Pacific Nickel Mines | 0.024 | 0% | 0% | 0% | -35% | 0% | $ 10,103,834.52 |
| AYM | Australia United Min | 0.002 | -33% | -33% | 0% | 0% | -50% | $ 3,685,154.97 |
| ANL | Amani Gold Ltd | 0 | -100% | -100% | -100% | -100% | -100% | $ 21,449,587.12 |
| HAV | Havilah Resources | 0.195 | 3% | -7% | 8% | 26% | -13% | $ 64,458,696.24 |
| SPR | Spartan Resources | 1.745 | 16% | 33% | 26% | 200% | 24% | $ 2,228,810,112.48 |
| PNT | Panthermetalsltd | 0.015 | -6% | 7% | -21% | -44% | 36% | $ 4,814,472.77 |
| MEK | Meeka Metals Limited | 0.1375 | 6% | 2% | 141% | 272% | 79% | $ 364,046,812.15 |
| GMD | Genesis Minerals | 3.715 | 15% | 17% | 76% | 98% | 50% | $ 4,066,893,828.00 |
| PGO | Pacgold | 0.073 | 20% | 6% | -39% | -48% | -3% | $ 9,464,712.34 |
| FEG | Far East Gold | 0.15 | -6% | -14% | -12% | 20% | -17% | $ 58,724,392.48 |
| MI6 | Minerals260Limited | 0.13 | 0% | 0% | 0% | -21% | 0% | $ 30,420,000.00 |
| IGO | IGO Limited | 4.275 | 11% | -7% | -15% | -44% | -10% | $ 3,278,969,630.29 |
| GAL | Galileo Mining Ltd | 0.14 | 4% | -3% | -13% | -43% | 12% | $ 27,667,489.78 |
| RXL | Rox Resources | 0.335 | 5% | 20% | 148% | 111% | 68% | $ 197,562,088.10 |
| PTN | Patronus Resources | 0.06 | 0% | -3% | 18% | -8% | 22% | $ 98,243,868.24 |
| CLZ | Classic Min Ltd | 0.001 | 0% | 0% | 0% | -93% | 0% | $ 1,544,025.56 |
| TGM | Theta Gold Mines Ltd | 0.155 | 0% | -11% | -9% | -6% | -14% | $ 127,414,293.90 |
| FAL | Falconmetalsltd | 0.135 | 13% | 4% | -29% | 23% | 17% | $ 26,550,000.00 |
| SPD | Southernpalladium | 0.42 | -1% | -7% | 12% | 27% | -30% | $ 38,199,000.00 |
| ORN | Orion Minerals Ltd | 0.016 | 0% | 14% | -6% | 23% | 7% | $ 109,607,165.09 |
| TMB | Tambourahmetals | 0.032 | 14% | 16% | -11% | -57% | 52% | $ 3,762,881.47 |
| TMS | Tennant Minerals Ltd | 0.013 | -7% | 8% | -19% | -55% | 44% | $ 14,338,356.23 |
| AZY | Antipa Minerals Ltd | 0.44 | 4% | 16% | 100% | 267% | 69% | $ 244,869,675.60 |
| PXX | Polarx Limited | 0.008 | 14% | 0% | -11% | -38% | 23% | $ 19,004,007.82 |
| TRE | Toubani Res Ltd | 0.18 | 20% | 16% | -36% | 57% | 6% | $ 41,212,792.62 |
| AUN | Aurumin | 0.064 | -2% | 0% | 56% | 88% | -3% | $ 32,126,909.36 |
| GPR | Geopacific Resources | 0.023 | 15% | 5% | -5% | 32% | 15% | $ 71,605,469.84 |
| FXG | Felix Gold Limited | 0.165 | 14% | 18% | 92% | 489% | 96% | $ 55,914,085.62 |
| ILT | Iltani Resources Lim | 0.24 | 9% | 4% | 0% | 85% | 17% | $ 10,648,235.04 |
| BRX | Belararoxlimited | 0.125 | 33% | -19% | -48% | -47% | -29% | $ 17,275,693.56 |
| TM1 | Terra Metals Limited | 0.02 | -5% | -33% | -46% | -60% | -29% | $ 8,152,701.24 |
| TOR | Torque Met | 0.105 | 6% | 5% | 22% | -30% | 98% | $ 28,314,712.23 |
| ARD | Argent Minerals | 0.024 | 14% | 9% | 41% | 140% | 41% | $ 36,141,012.00 |
| LM1 | Leeuwin Metals Ltd | 0.105 | -13% | -16% | 24% | 22% | -25% | $ 6,896,038.16 |
| SX2 | Southgold Consol | 4.5 | 20% | 25% | 0% | 0% | 0% | $ 514,416,567.00 |
Standout gold stocks of the week
The $21m capped Malaysian gold developer has run higher after responding to a price query from the ASX and aware letter.
BEZ, which holds around 3Moz of gold resources at its Bau gold project in Sarawak, was responding to a cease trade order related to filing dates for its financials in Canada, which are shorter for non-venture listings (a category that it's placed in by virtue of its ASX listing).
Its 98.5%-owned Bau project has a very high confidence measured resource of 3.4Mt at 1.5g/t gold, or 166,000oz of contained gold, a high confidence indicated resource of 16.4Mt at 1.57g/t gold, or 824,800oz contained gold, and an inferred resource of 47.9Mt at 1.29g/t, or ~1.99Moz contained gold.
Bau is defined by a gold-bearing mineralisation system covering an 8km by 15km corridor.
The company’s planned Jugan 50tpd pilot plant will trial various batch processing combinations in order to develop optimal protocols for processing the Jugan refractory ore to produce a concentrate for further processing, including doré.
These trial results will form an important component of the overall definitive feasibility study for future commercialisation.
BEZ also has the required licensing and capability to increase the processing throughput to up to 200tpd.
North Stawell Minerals (ASX:NSM)
NSM followed in the footsteps of other recent bolters like New Murchison Gold (ASX:NMG) and Trek Metals (ASX:TKM), reporting visible gold from drilling at its Darlington project in Victoria's Stawell corridor, home to the operating Stawell gold mine.
"It’s highly encouraging to drill through a gold-mineralised structure on our way to the planned target. Visible gold is not as common in mineralisation around Stawell as it is elsewhere in Victoria. The intercept – a siliceous, stock-worked breccia – occurs in an unexpected position to the west of the historic Darlington Mine trend," NSM exec director Campbell Olsen said.
"However, the alteration and mineralisation appear to have geological similarities to the mine spoils at the historic mine, so an association between the two areas is possible.
"The significance of the intercept will only become clear when laboratory results are returned, but visible gold in this structure adds to the geological potential of the Darlington target, 6km north of the operating mine at Stawell.”
At Stockhead, we tell it like it is. While Besra Gold is a Stockhead advertiser, it did not sponsor this article.
Originally published as Gold Digger: After breaking US$3000/oz, gold could still move higher

A national champion in tungsten production
Tungsten supply has suddenly become a critical thing in Europe and the US thanks to Chinese export bans and rising defence spending.

Battles intensifies for CZR iron ore
Competition for the 98.4Mt Robe Mesa project iron ore resource of CZR Resources has heated up with the Robe River Joint Venture led by iron ore giant Rio Tinto joining the fray.

ASX up, Greenhy2 soars 300pc
The ASX ended the week on a high note as Woolies and Coles soared. Miners took a hit, however, after Trump’s exec order.

Aussie moguls’ family offices fuel sustainability
Family offices are booming in the Asia-Pacific, backing sustainability projects with big players like Grok, Tattarang, and Wedgetail leading.

Woolies, Coles cleared; miners rattled by Trump
The local market has swung between green and red on Friday. At lunch time AEDT, the ASX 200 index had bounced back by 0.3%.
Broker backs Boss to beat shorts
Uranium miner Boss is the most shorted stock on the ASX. But broker Euroz has initiated with a hefty price target.