New data reveals best and worst schools for teacher ratios in Australia
New data has revealed the best and worst schools in the country, exposing glaring divides between public and private schools and different states.

New data has revealed the best and worst schools for student to teacher ratios, and it makes concerning reading for parents nationwide.
The 2021 data from the My Schools website shows exactly how many students there were for each teacher in every school in the county.
There were glaring differences across the board, with NSW data exposing the stark staffing divide between public and private schools, while comparison of the Queensland and Victorian data showed children in one state were far better off.
Here is your brief guide to the results by state, including the top five primary and secondary schools, with links to our interactive map to show you how things stand in your school.
NEW SOUTH WALES
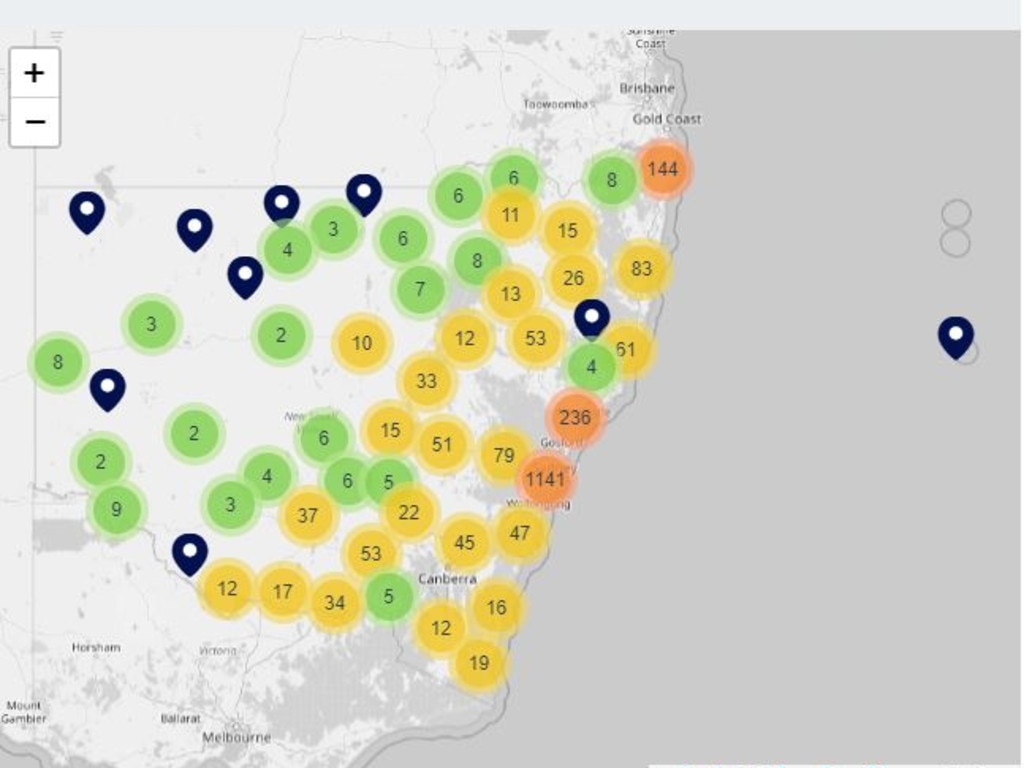
SEE THE FULL LIST OF NSW SCHOOLS HERE
A trove of 2021 student to teacher ratios for every school has exposed the stark staffing divide between NSW’s public and private schools, with the Sydney region experiencing the biggest gap.
Public schools in Northern Sydney had four students per teacher more on average that their Catholic and independent counterparts. Government schools in the area had a ratio of 16.8:1, three points above the state average of 13.7. Students at non-government schools, meanwhile, were in a ratio of 12.4:1.
Similarly, in the inner city there are 2.6 more students being taught by each public school teacher on average. Of the ten inner Sydney schools with the highest teacher to student ratios, seven were public primary schools.
NSW’s average of 13.7 students to each full time employed teacher is the second highest ratio in the country, pipped only slightly by Western Australia at 13.8:1. In 2021 the Northern Territory had the lowest ratio of 11.9:1.
The NSW Central Coast had the least number of teachers per student on average, sitting 1.7 points above the state average. Both government and non-government schools on the Central Coast have around 15 students to each one teacher.
NSW WORST TEACHER STUDENT RATIOS
1. Al Hikma College, Lakemba
2. St Mary’s Catholic Primary School, Dubbo
3. Al-Faisal College, Liverpool
4. St Joseph’s Primary School, Merewether
5. Wangi Wangi Public School, Wangi Wangi
QUEENSLAND
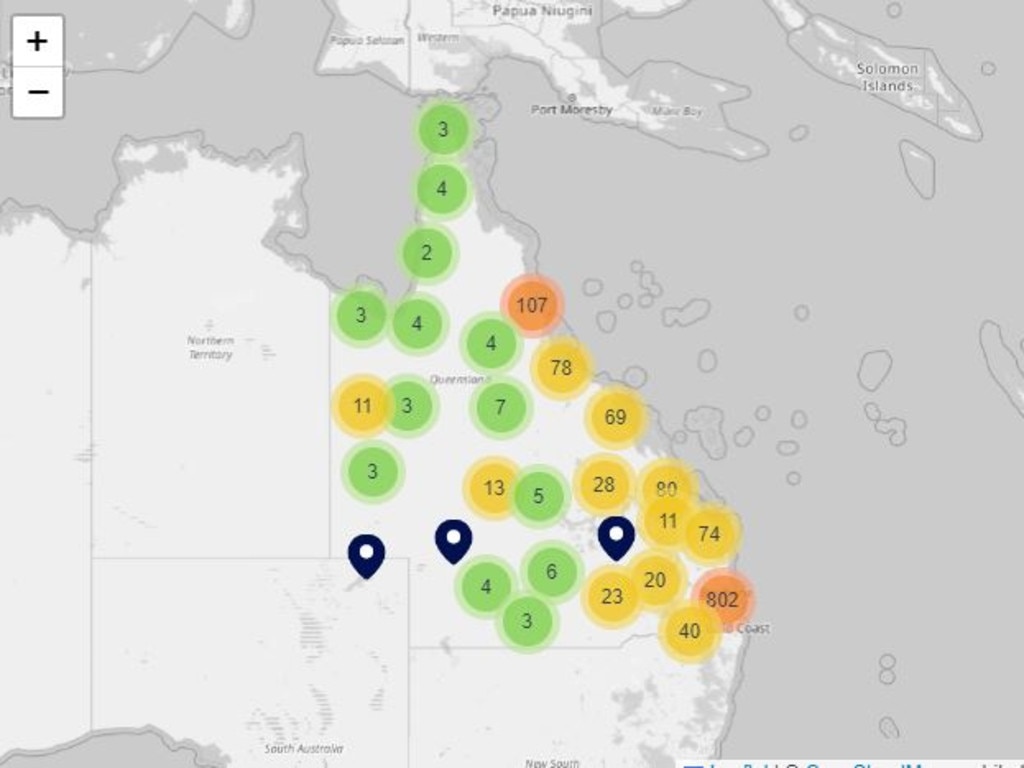
SEE THE FULL LIST OF QUEENSLAND SCHOOLS HERE
More than half of Queensland schools have student-teacher ratios worse than the national average, and hundreds of schools who have better ratios than the country’s norm are classified as either “micro” or “small” institutions.
The majority of Brisbane’s elite private schools beat the national average, but notable schools who didn’t were Villanova College in Coorparoo, Genesis Christian College at Bray Park, King’s Christian College in Reedy Creek, and St Rita’s College in Clayfield.
The state’s regional public schools also made a strong showing and scored some of the best ratios – particularly a large state school on Thursday Island off Queensland’s Far North.
QLD WORST TEACHER STUDENT RATIOS
School Name
1. Charters Towers School of Distance Education, Millchester
2. Cairns School of Distance Education, Manunda
3. Pinnacle Academic College, Kallangur
4. Applethorpe State School, Applethorpe
5. Townsville Christian College, Vincent
VICTORIA
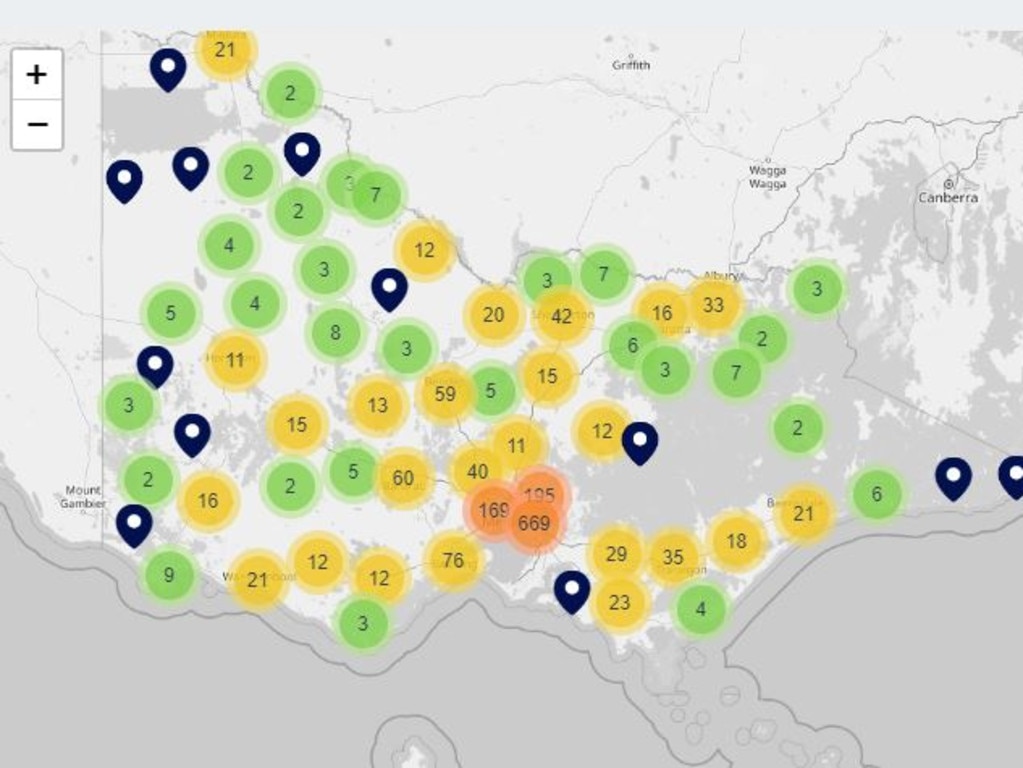
SEE THE FULL LIST OF VICTORIA SCHOOLS HERE
Lucky students at some Victorian primary schools have almost as many teachers as students.
New student-staff ratio data reveals tiny schools such as Olinda Primary School, located in the Dandenong Ranges, have just 10 students and 3.6 full-time equivalent teachers.
This accounts for the number of teachers making up full-time positions, including part-time staff.
Dhurringile Primary, located nearly 30 km from Shepparton, and Ultima Primary, 350 km west of Melbourne, both have just two students and 1.6 staff – the smallest in the state.
On average, Victorian primary schools have 13.1 students for every teacher, 2021 data from the My Schools website shows.
The smallest secondary and combined provider (primary and secondary in one school) is Fernbrook School in The Basin which has 21 students and three staff members – a ratio of seven.
Other micro schools enjoying great low ratios include Lynall Hall Community School in Richmond, Cann River P-12 and Sydney Road Community School in Brunswick.
VIC WORST TEACHER STUDENT RATIOS
1. Lighthouse Christian College Cranbourne, Cranbourne
2. Virtual School Victoria, Thornbury
3. Saltwater P-9 College, Point Cook
4. Emerald Primary School, Emerald
5. Puckapunyal Primary School, Puckapunyal
SOUTH AUSTRALIA
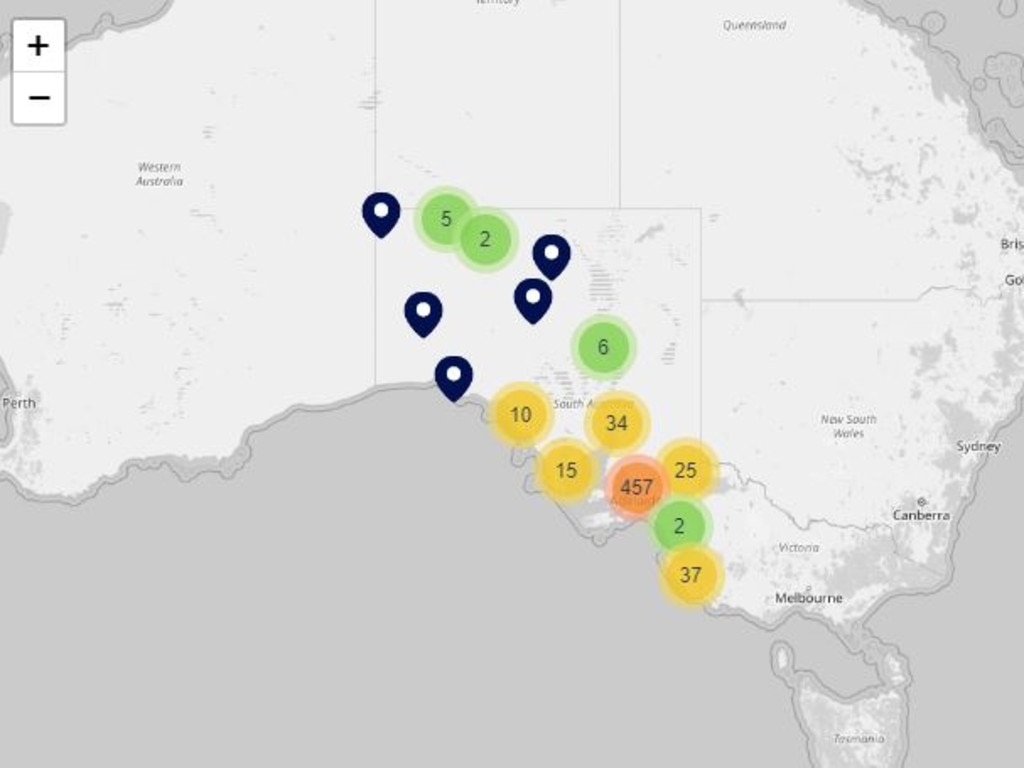
SEE THE FULL LIST OF SOUTH AUSTRALIAN SCHOOLS HERE
Over 1000 South Australian children with mental health issues are receiving online learning from a public school with the biggest student to teacher ratio in the state.
Latest official figures from 2021 released nationally show Open Access College had 115 teachers for 4726 students – a ratio of 40.9 compared to the state average of 13.4.
Principal Julie Taylor said the government school’s enrolment since had reduced, with 190 teachers and support staff now providing virtual education to almost 4300 students.
Ms Taylor said this included a growing number of children and teenagers who were not attending school because of psychological issues related to anxiety, depression, bullying, autism or gender diversity.
SA WORST TEACHER STUDENT RATIOS
1. Open Access College, Marden
2. Echunga Primary and Preschool, Echunga
3. Ardtornish Primary School, St Agnes
4. Gulfview Heights Primary School, Gulfview Heights
5. Whitefriars School, Woodville Park
TASMANIA
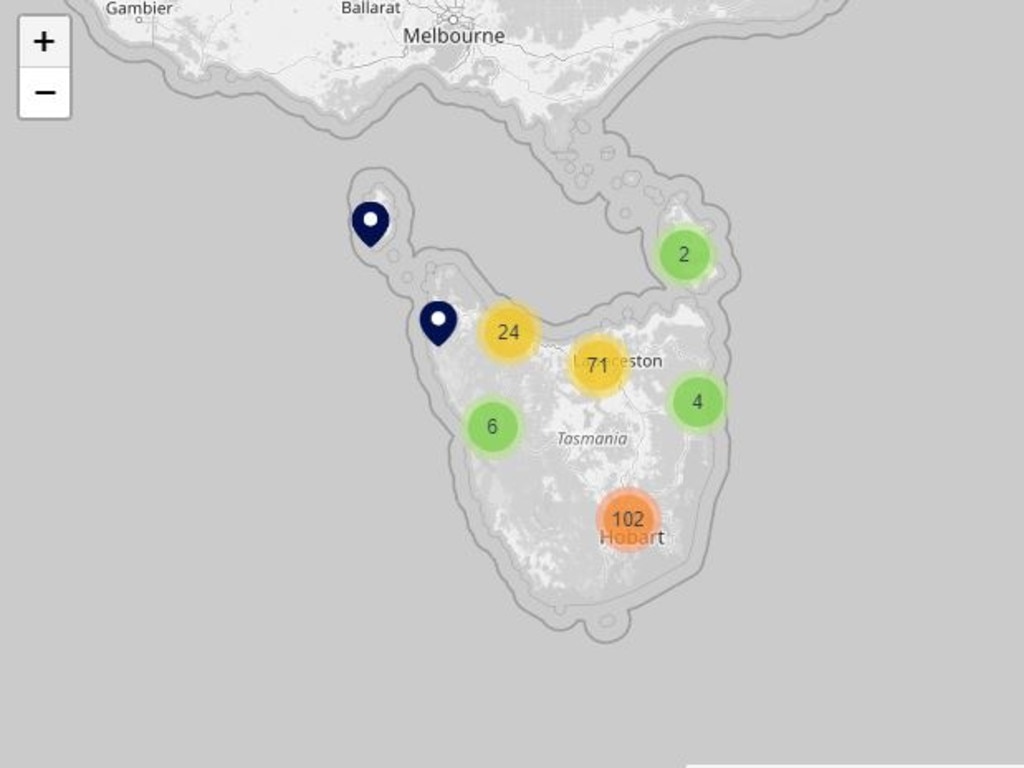
SEE THE FULL LIST OF TASMANIAN SCHOOLS HERE
Meanwhile, in Tasmania more than half the state’s schools are behind the national average for student-teacher ratios.
In 2021 there were more students per teacher at both Youngtown Primary School and Sacred Heart Catholic School than any other schools in Tasmania — both having 18.4 students for every teacher.
Tasmania’s least crowded classroom was at St Joseph’s Catholic School in Rosebery, on the West Coast, where there was an average of 4.9 students for every teacher at the school — 8.1 full-time equivalent teachers for its 40 enrolled students.
TAS WORST TEACHER STUDENT RATIOS
1. Sacred Heart Catholic School, Launceston
2. Youngtown Primary School, Youngtown
3. Our Lady of Lourdes Catholic School, Devonport
4. Cooee Primary School, Cooee
5. Devonport Christian School, Don
NORTHERN TERRITORY
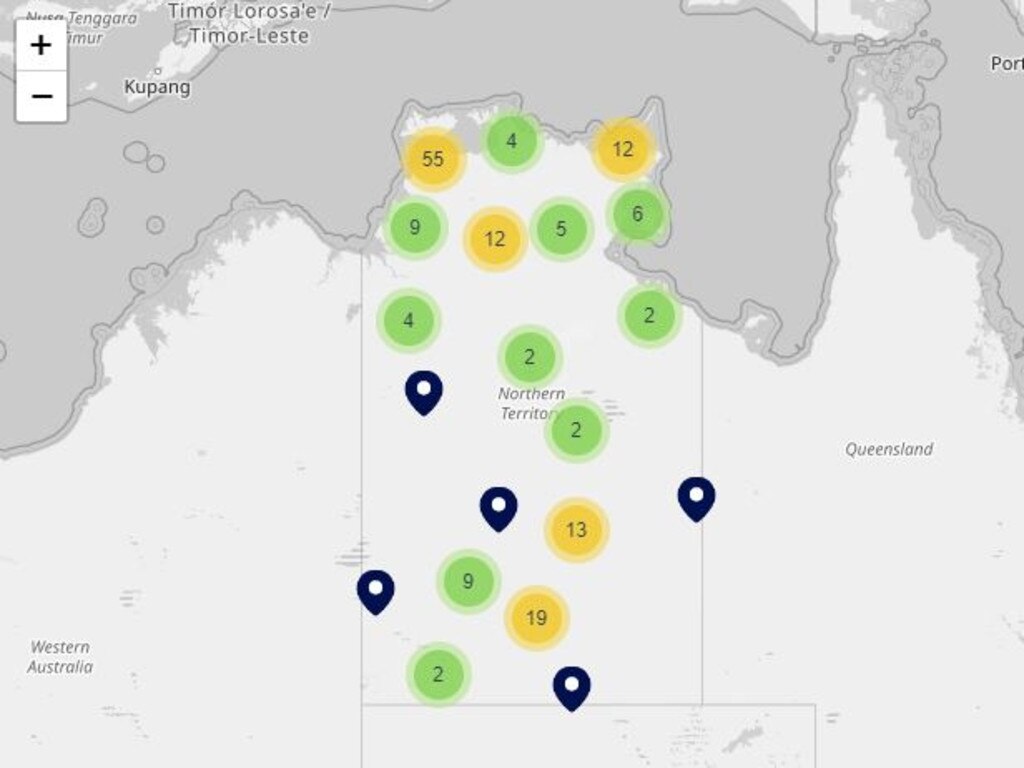
SEE THE FULL LIST OF NORTHERN TERRITORY SCHOOLS HERE
Nightcliff Primary School, in one of the Top End’s most affluent suburbs, had a higher teacher student ratio than any other Darwin school at 16.8 students per teacher, however this was significantly better than Alice Springs’ highest ratio of 20 students per teacher at Willowra School.
Palmerston’s least crowded school was Woodroffe Primary with an average of 9.6 students per teacher, while its most packed was Mother Teresa Catholic Primary School at 19.8 pupils for every teacher.
The good news is that about two-thirds of Territory schools, both primary and secondary, were below the national student-teacher ratios of 14.5 and 11.9 respectively.
NT WORST TEACHER STUDENT RATIOS
1. Bulman School, Bulman Weemol
2. Watiyawanu School, Mount Liebig
3. Gawa Christian School, Galiwinku
4. Willowra School, Willowra
5. Wallace Rockhole School, Wallace Rockhole

