Teacher student ratios ranked: How every NSW school compares
Student to teacher ratios in one NSW region have been blasted as “appalling” after being revealed as the state’s highest. See how your school stacks up.
Schools Hub
Don't miss out on the headlines from Schools Hub. Followed categories will be added to My News.
School resourcing on the Central Coast has been blasted as “appalling” after analysis of every NSW school’s 2021 student to teacher ratios revealed the region to be the state’s least staffed.
Data sourced from the Australian Curriculum and Assessment Reporting Authority’s My School portal shows the NSW Central Coast had the least number of full-time employed teachers per student on average, sitting 1.7 points above the state average of 13.7:1.
Both government and non-government schools on the Central Coast have around 15 students to each teacher.
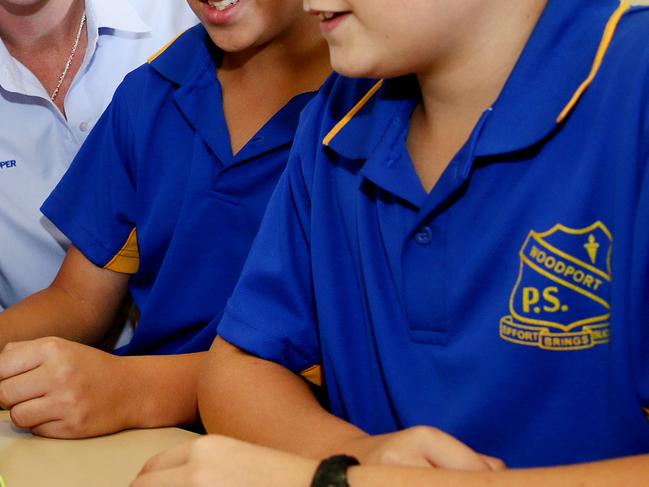
At the extremes, Woodport Public School in Erina had a ratio of 20.3:1, the 16th highest ratio of all NSW schools. Chertsey Primary School, a small school just a four-minute drive away, had the lowest ratio of all schools on the Central Coast, with 8.8 students to every teacher.
President of the Central Coast Council of P & Cs Sharryn Brownlee said it was “appalling” to see her region at the bottom of the list.
“Parents and the wider community would be shocked to learn of the lack of investment in children on the Central Coast,” Mrs Brownlee said.
“Ratios are vitally important, and people think it only matters in the early years. They have a direct correlation to the outcome for students … teachers need to take time to assess their students and to program directly for their needs. To see a disadvantaged area continually, time and time and time again, left behind is heartbreaking.”
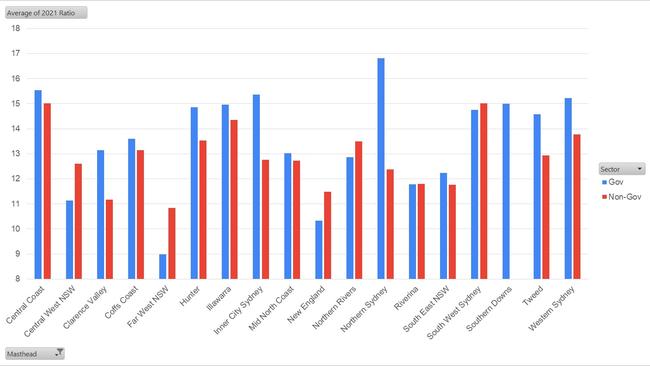
The data also reveals the stark staffing divide between NSW’s public and private schools, with parts of Sydney experiencing the biggest gaps.
Public schools in Northern Sydney had four students per teacher more on average that their Catholic and independent counterparts. Similarly, in the inner city there are 2.6 more students being taught by each public school teacher on average.
NSW’s average student to teacher ratio in 2021 was the second highest in the country, pipped only slightly by Western Australia at 13.8:1. The Northern Territory had the lowest ratio of 11.9:1.
Among public schools, the ratio of students to teachers had fallen to 14.3:1 from a ten-year high of 15.6:1 in 2019.
Ratios in the most remote parts of the state were the lowest, due to a significant proportion of government funding being allocated to small outback schools with a greater number of Indigenous students.
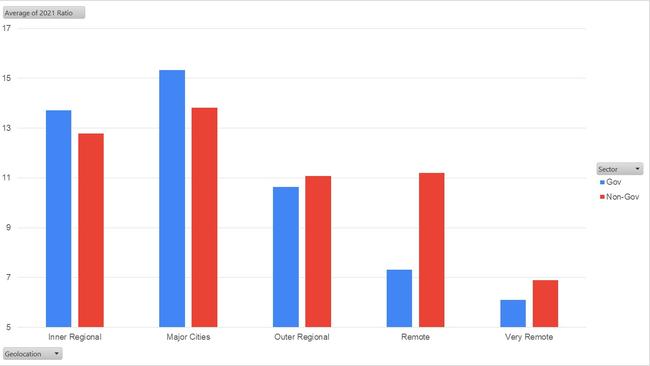
The public versus private script is flipped for the outer regions, remote and very remote communities too, with the number of students to each teacher much higher for non-government schools.
Catholic primary schools account for four of the five highest ratios in remote NSW, for example.
Education Minister Sarah Mitchell said public school parents shouldn’t be concerned that their kids are missing out, with the teaching workforce growing “at twice the rate of student numbers”.
“What parents need to know is that NSW public schools have some of the lowest student to teacher ratios in a decade. Even the highest ratios in some parts of the State, such as one teacher for every 16 students, is well below benchmark levels,” she said.
“Needs based funding means that those with highest need – like in Far West NSW – receive the most funding.
“This investment is delivering record numbers of additional teachers being employed by schools to meet student need.”
Got a news tip? Email eileidh.mellis@news.com.au


