
House prices in ’fastest decline on record’ as they drop across all major cities
House prices across all of Australia have experienced a massive drop and all signs point to it being the largest house price correction on record.
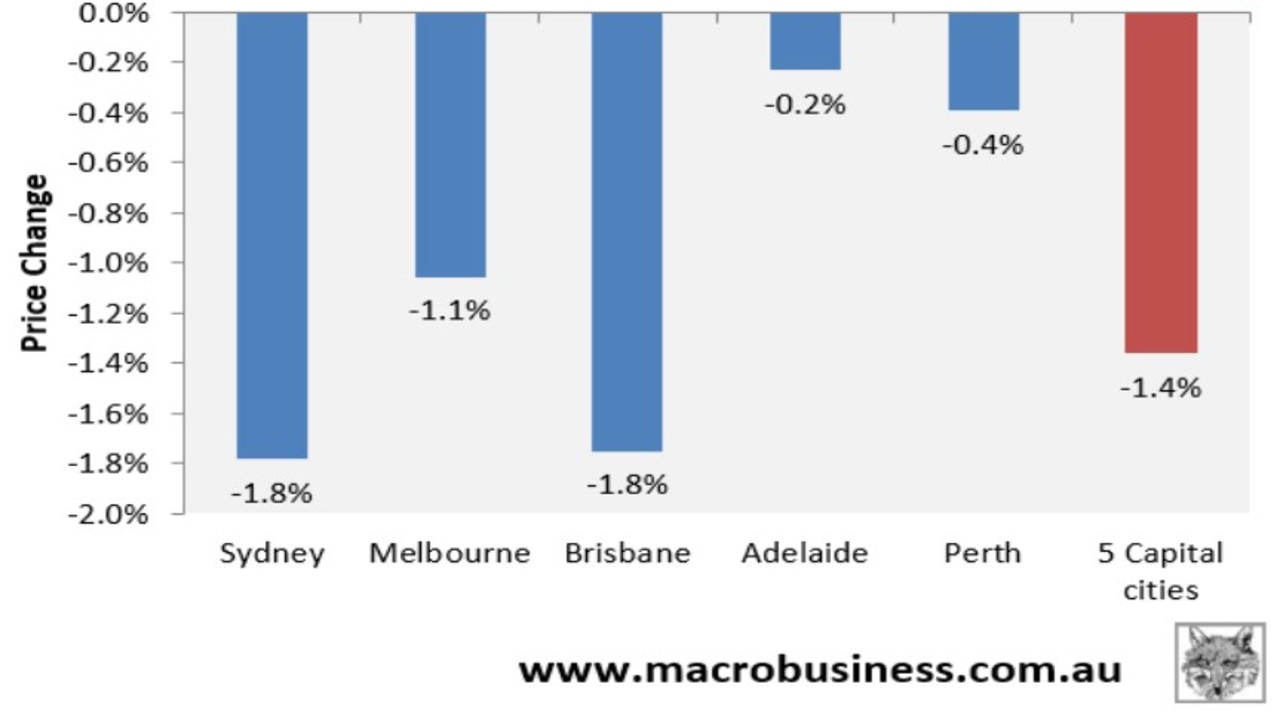
Dwelling value results for September recorded another 1.4 per cent decline nationally – the fifth consecutive monthly price fall.
Every major capital city recorded falling values, with the ‘big three’ of Sydney (-1.8 per cent), Melbourne (-1.1 per cent) and Brisbane (-1.8 per cent) faring worst, according to CoreLogic.
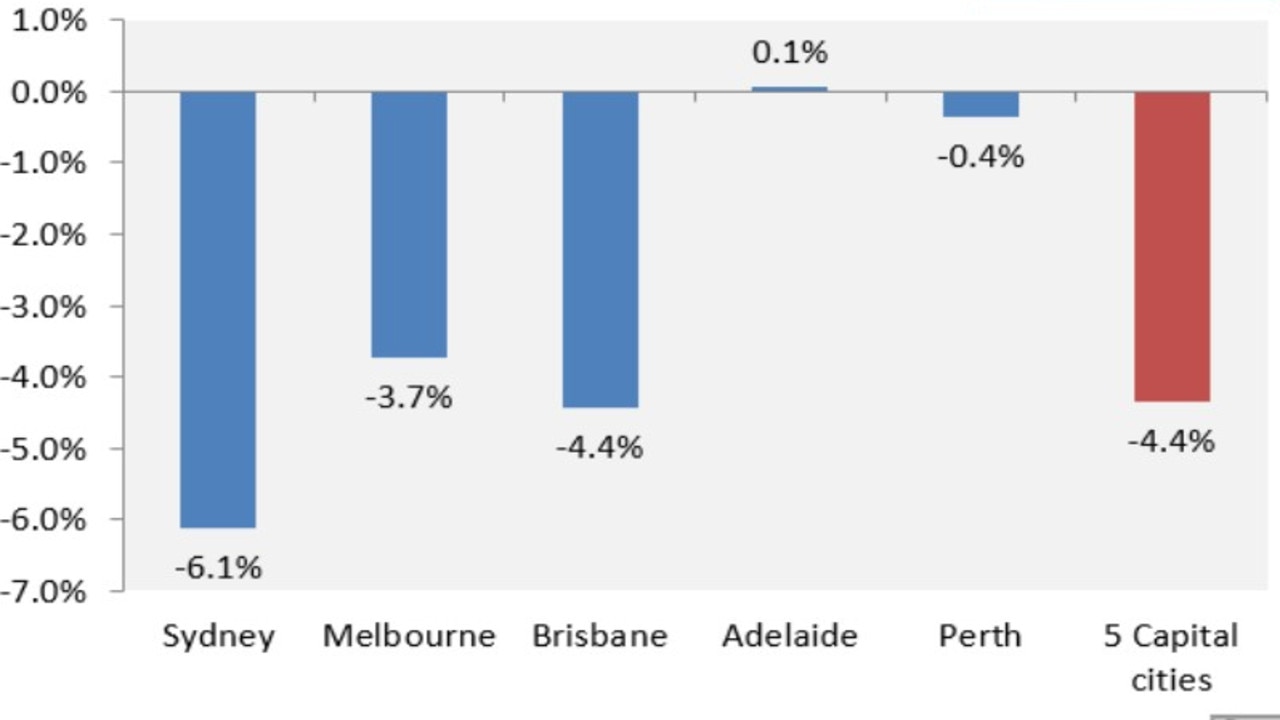
The quarterly pace of decline accelerated to 4.4 per cent at the five-city aggregate level, driven by heavy falls across Sydney (-6.1 per cent), Melbourne (-3.7 per cent), and Brisbane (-4.4 per cent). Perth (-0.4 per cent) also recorded falling values, whereas Adelaide (0.1 per cent) remained in positive territory over the quarter.
Wondering what can cause falling house prices? Check out Compare Money's guide >
The quarterly decline in dwelling values over the September quarter was the steepest since 1983 at both the five-city aggregate level and across Sydney. Melbourne’s quarterly decline moderated slightly from August’s 3.8 per cent fall whereas Brisbane’s was the city’s fastest quarterly decline since February 2019.
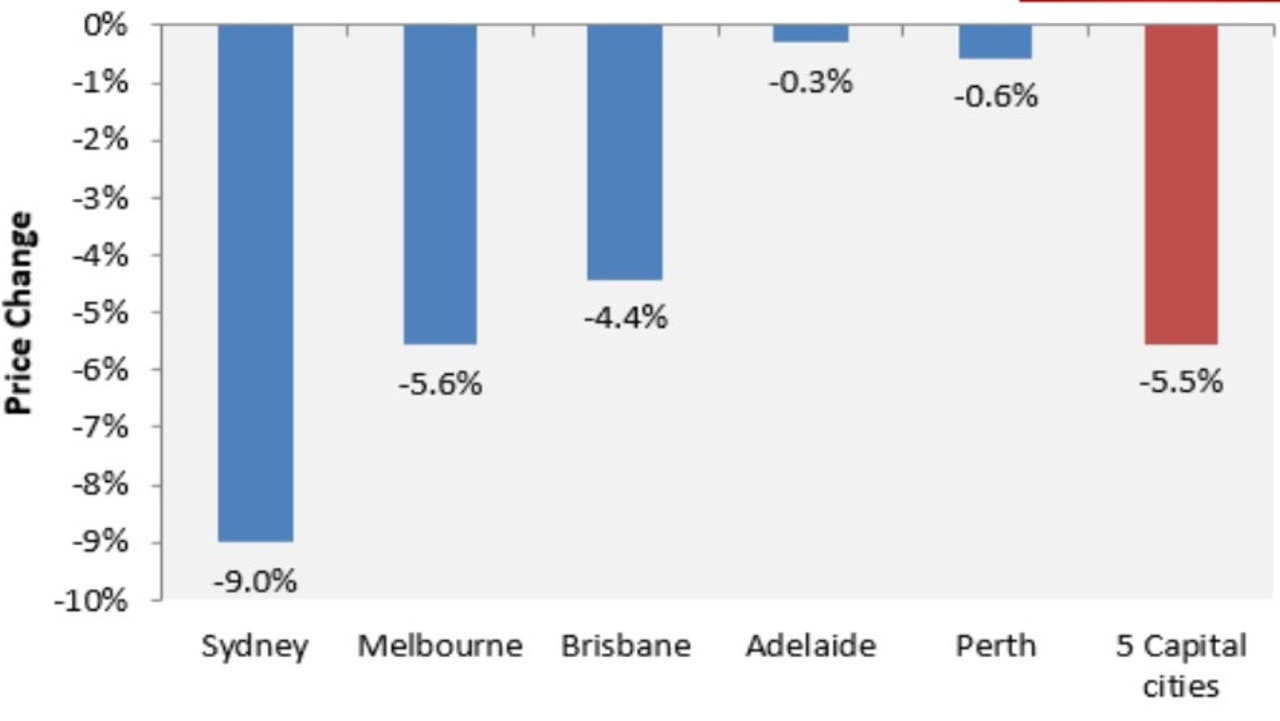
Dwelling values at the end of September were tracking 5.5 per cent below their April peak at the five-city aggregate level, with Sydney down 9.0 per cent, Melbourne down 5.6 per cent, and Brisbane down 4.4 per cent. Perth (-0.6 per cent) and Adelaide (-0.3 per cent) have only recently joined the nation’s housing correction:
The fastest house price decline on record
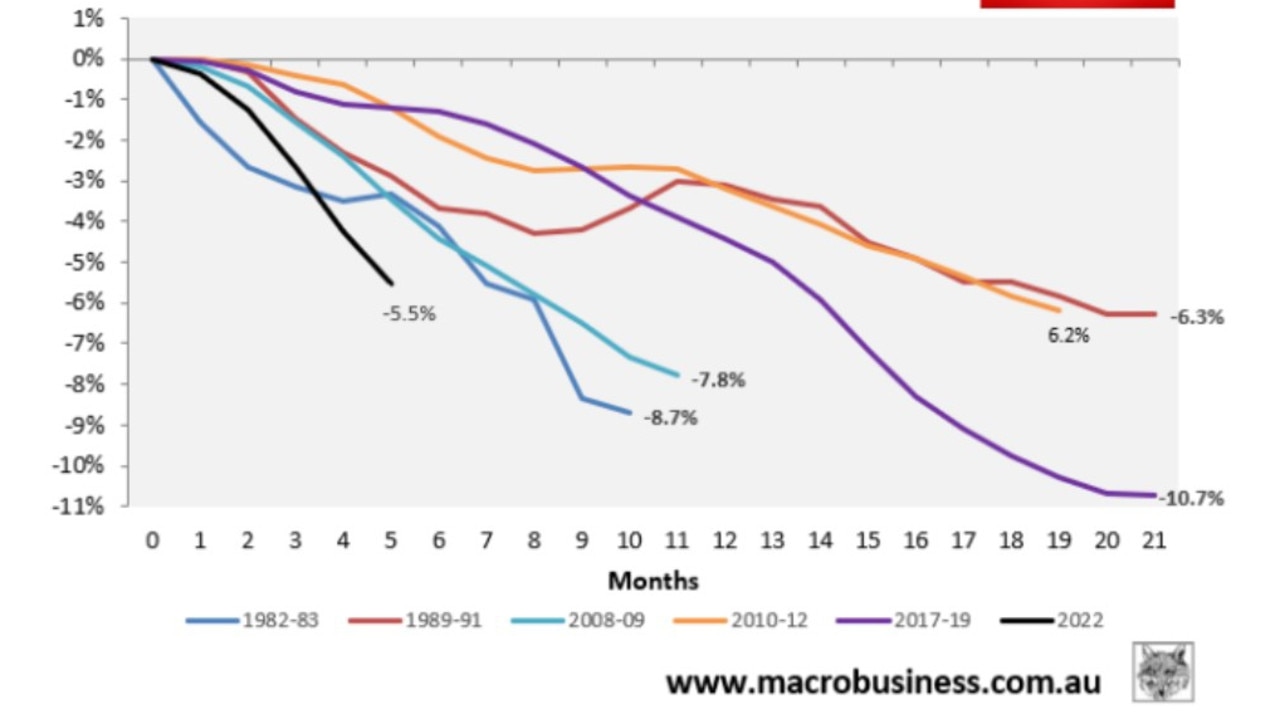
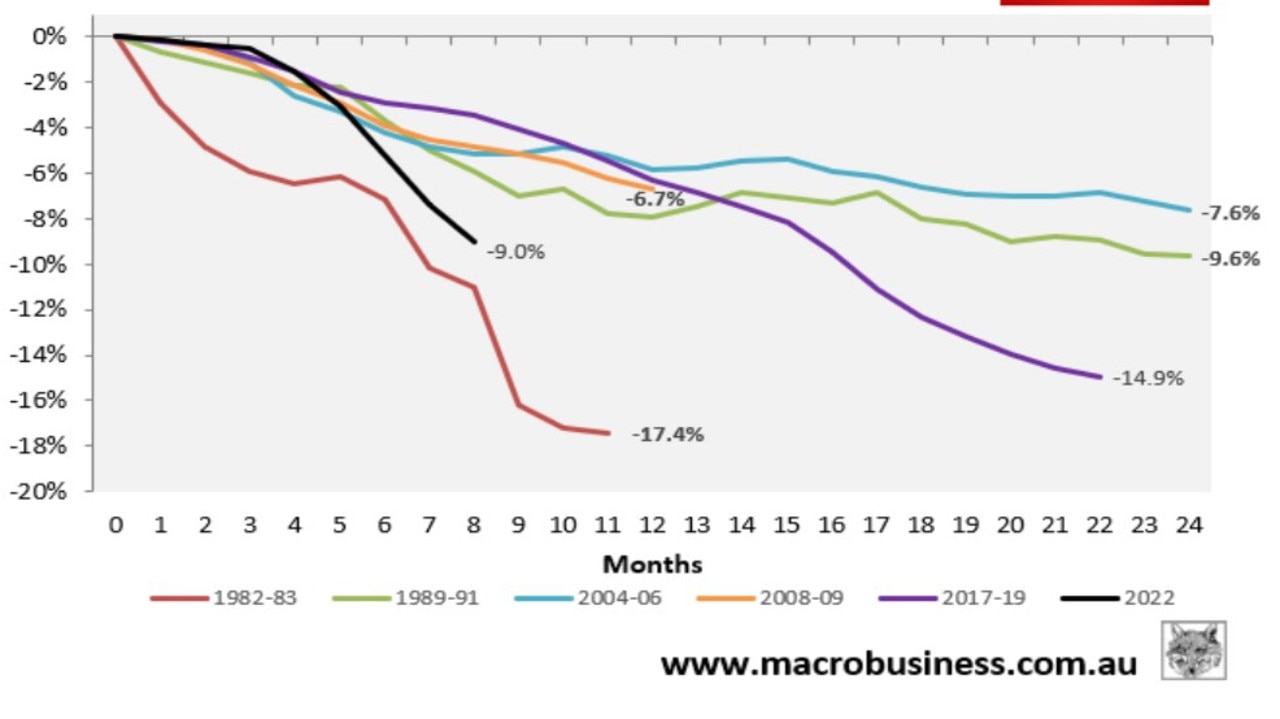
The below charts plot the current dwelling price declines at the five-city aggregate level and across Sydney, Melbourne, and Brisbane (shown in black) against prior corrections, using CoreLogic records dating back to 1980.
At the five-city aggregate level, the 5.5 per cent decline over the five months to September is significantly smaller than the corrections of 2017-19 (10.7 per cent over 21 months) or 1982-83 (8.7 per cent over 10 months).
However, the current episode is easily the fastest decline at this stage of the cycle on record.
Sydney’s current 9.0 per cent house price decline has a long way to go before it reaches the depths of the 1982-83 bust (-17.4 per cent over 11 months) or the 2017-19 correction (-14.9 per cent over 23 months). However, the pace of decline is the second fastest on record at this stage of the downturn (i.e. eight months in).
Moreover, unlike the 1982-83 bust, the current correction began slowly in February only to gather strength after the Reserve Bank of Australia (RBA) began lifting interest rates in early May.
Melbourne’s current house price decline has now matched the 2020 early pandemic fall (i.e. –5.6 per cent after seven months). It is also the equal second steepest on record behind the 2008-09 decline (which was -6.1 per cent seven months in).
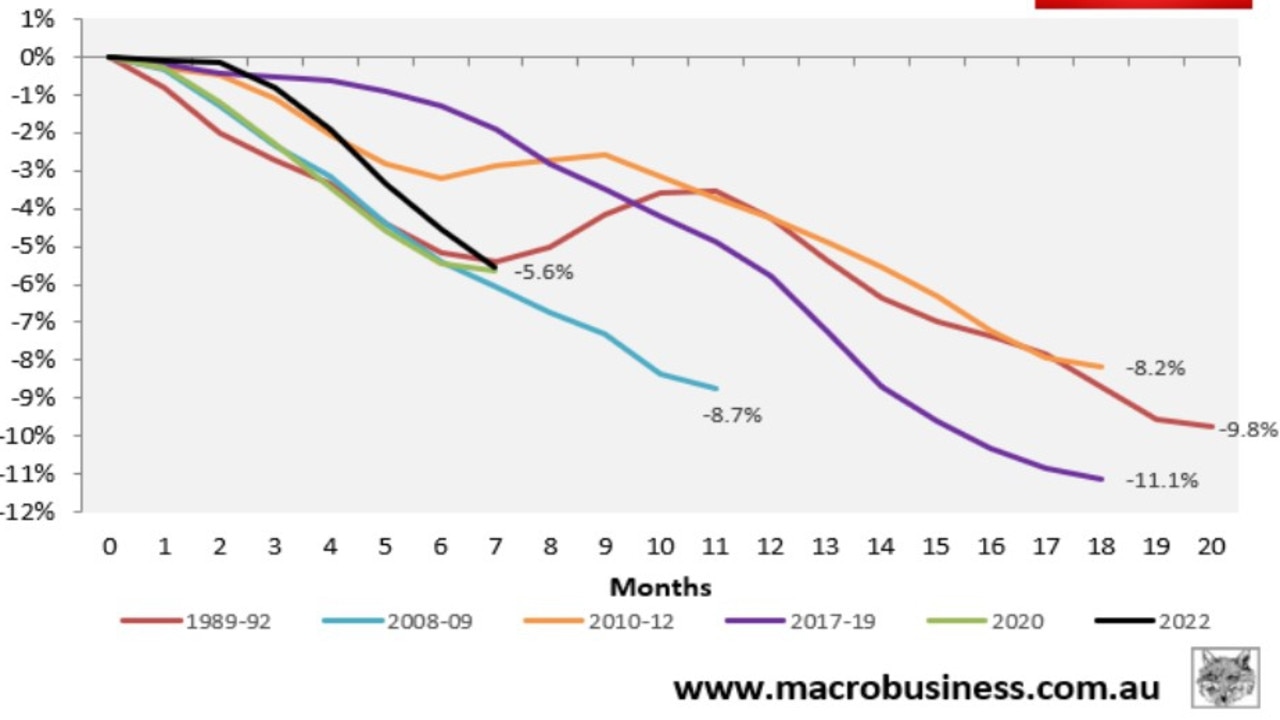
However, Melbourne’s current correction is only halfway to matching the record decline of 11.1 per cent over 18 months between 2017 and 2019.
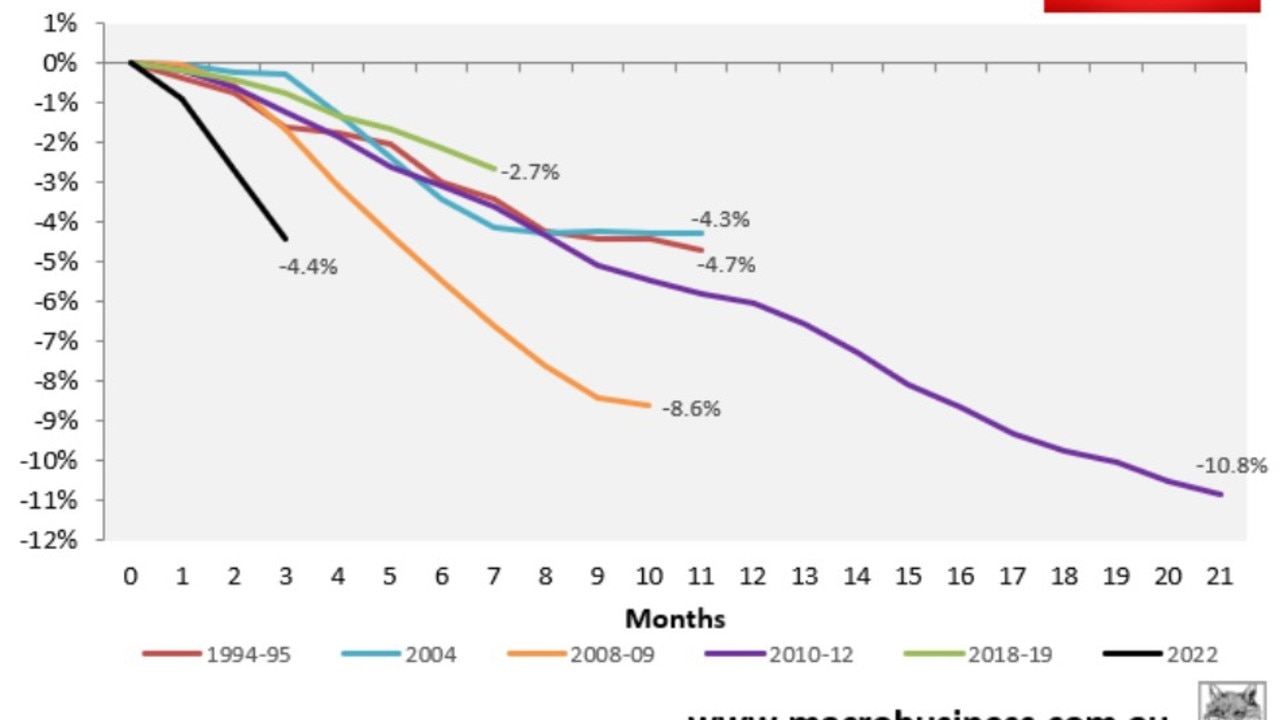
Brisbane’s current 4.4 per cent house price decline has a way to go before it matches the 2010-12 bust (-10.8 per cent over 21 months) or the 2008-09 correction (-8.6 per cent over 10 months). However, it is easily the fastest on record at this stage of the downturn.
Australian faces its biggest ever house price correction
Ultimately, how deep Australia’s housing correction goes will depend on whether the RBA continues to lift interest rates, given higher mortgage rates lowers borrowing capacity and reduces housing demand.
Last week’s smaller than expected 0.25 per cent rate hike was a good sign as it suggested we may be nearing the end of the RBA’s rate tightening cycle.
That said, the RBA’s monetary policy statement did state that “the Board expects to increase interest rates further over the period ahead”. Therefore, we could still see a few more 0.25 per cent hikes before the official cash rate peaks.
The RBA’s latest Financial Stability Review estimated “that a 200-basis-point increase in interest rates from current levels would lower real housing prices by around 15 per cent over a two-year period”.
Given the official cash rate has already risen by 2.5 per cent from April’s low, with at least another 0.25 per cent hike likely, Australia is facing a peak-to-trough decline in real house prices of at least 20 per cent, or more than 12 per cent nominally.
Since Australian capital city dwelling values have never declined by more than 11 per cent, this would represent the largest house price correction on record.
Leith van Onselen is Chief Economist at the MB Fund and MB Super. Leith has previously worked at the Australian Treasury, Victorian Treasury and Goldman Sachs.

RBA boss makes grim prediction
The Reserve Bank has revealed the reason behind its shock decision to hold the cash rate, leaving homeowners waiting a bit longer for much-needed relief.

‘Too long’: Plan to crack huge housing hurdle
Ahead of major Australian economic meetings next month, a big change to housing has been floated. This is how it could impact your future tax bills.

‘Dirty secret’: Big bank’s call on rate hold
Struggling mortgage holders could be waiting an additional five weeks for a rate cut just so the RBA can prove its independence, a former employee says.