Australia’s top 50 ASX-listed agribusinesses of 2021
Australian agribusiness is handling the pandemic better than other sectors. See how the ASX-listed top 50 for 2021 is weathering the coronavirus storm.
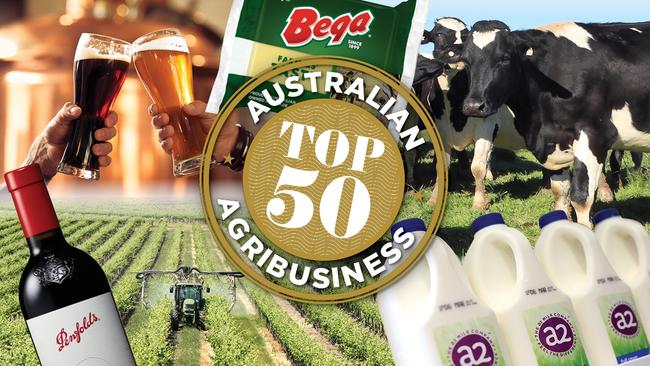
THE past 12 months will go down in history as the year the world was thrown on its head by a global pandemic.
When AgJournal published its inaugural list of the top 50 Australian Securities Exchange-listed agribusinesses in early March last year, no one could have predicted how COVID-19 would affect global markets. But when global sharemarkets collapsed on March 23, few listed companies around the world were spared the wrath.
Many Australian-listed food-producing agribusinesses did, however, initially weather the storm better than most non-agriculture ASX companies.
By May, 90 per cent of the top 30 agribusinesses had outperformed the failing All Ordinaries Index, partly due to agriculture being declared an essential industry, allowing agribusiness to continue with minimal restrictions.
But another factor was probably more blatantly obvious: even as the virus enveloped the world, people still needed to eat.
RANKINGS on AgJournal’s top 50 list is by market capitalisation: a function of the number of shares on issue and the share price.
The big bolter has been West Australian regenerative beef, lamb and vegetable producer Wide Open Agriculture. Its share price is now six times what it was prior to the sharemarket collapse and in August rose to 15 times pre-pandemic levels.
Its market capitalisation was about $8 million last March but now it is $65 million. The company was ranked 47 last year but is 31 this year.
Working in its favour is a growing consumer appetite for food grown along strict environmentally friendly principles.
Three companies in last year’s top 50 have been removed because their shares are not trading on the ASX.
Dairy manufacturer Freedom Foods is in the sin bin for irregularities in its accounts going back a few years, infant formula maker Wattle Health Australia has further become a basket case and crop technology company CropLogic always struggled to make the big time and is now in administration.
THE big companies on this year’s list – those with market caps of $1 billion or higher – have experienced mixed fortunes.
Elders, Costa Group and Bega Cheese have performed well, with COVID-19 virtually irrelevant, while the two biggest listed agribusinesses – Treasury Wine Estates and The a2 Milk Company – have been hit by the side-effects of the disease.
Elders has flourished through solid, organic growth underpinned by the company’s strategic plans. As a consequence, its share price has risen about 35 per cent from its pre-COVID level.
Costa Group has struggled through recent years of poor weather and drought affecting its performance, but its FY20 results show it has turned the corner with a healthy $65 million profit.
Bega Cheese’s fortunes are linked to its successful bid for the Lion Dairy & Drinks division of Japanese owner Kirin.
The takeover will see Bega Cheese’s annual revenue jump from about $1.5 billion to $3 billion when a full year of trading is complete.
Last year, The a2 Milk Company was the cream of the ASX agribusiness sector with a market cap of $11 billion, based on a share price of about $15.
The New Zealand-based dairy company’s share price hit $20 in July but plummeted to about $10 in December when the company announced it got its FY21 forecasts wrong.
It has now lost its crown as Australia’s top listed agribusiness to Treasury Wine Estates, which last month split its business into three divisions in a bid to unlock value of its brands.
TWE has not been without its problems in recent months. It has been hit hard by China’s import tariffs imposed on the wine sector, designed to punish the Australian Government for calling for an investigation into the origin of COVID-19, among other issues.
But it is not alone. About a quarter of the agribusinesses listed on the ASX – and many unlisted exporters – have been affected by the Chinese Government’s bullying of Australia over political issues.
The confrontation with China is a major issue for the Australian agriculture sector. Agribusiness leaders want the China problem sorted out, but they vary in their views on how that should be tackled.
Select Harvests and Rural Funds Management board member Mike Carroll doesn’t believe Australia should be pushed around and treated like a misbehaving child by China.
“The better tactic is to ignore China. We have to stand by our values and principles,” Carroll says.
“Agriculture is in a real purple patch at the moment. The challenge is to make good during a boom time to set us up for the long term.”
David Williams, principal of corporate advisory firm Kidder Williams, says Australian exporters must look at alternative markets.
“Countries such as Vietnam, Singapore, Hong Kong and Indonesia offer opportunities,” Williams says. “We may be able to use people in Indonesia and Vietnam as a way of getting into China, even if we can’t go through the front door.”
Agribusiness Australia president and Elders managing director Mark Allison holds a different view on China.
“You don’t upset your major destination. It’s the second-biggest economy in the world,” he says. “But we need to make sure we balance our growth with other markets if the China issues continue.”
COVID-19 has probably caused the biggest disruption Australian agribusiness is likely to see in decades. Nimbleness in responding to the core threat, but also side-effects, will determine how they prosper in the short and medium term.
AUSTRALIA’S TOP 50 ASX-LISTED AGRIBUSINESSES
* Dollar figures in millions

1. TREASURY WINE ESTATES
Wine production
ASX CODE TWE
MARKET CAPITALISATION 2021 $7,986.35
MARKET CAPITALISATION 2020 $7,807.81
REVENUE FY20 $2,678.20
REVENUE FY19 $2,883.00
NET PROFIT (LOSS) FY20 $260.80
NET PROFIT (LOSS) FY19 $419.50
TREASURY Wine Estates has dethroned The a2 Milk Company as Australia’s biggest listed agribusiness.
Last month’s move to split the wine company into three semi-autonomous brand divisions prompted investors to boost its share price, hence its rise up the charts to top spot.
The company will now operate a global luxury division called Penfolds, its US brands under Treasury Americas and a number of well-known Australian and New Zealand brands – including Wolf Blass, Wynns, Seppelt and 19 Crimes – under the roof of Treasury Premium Brands.
The strategy will see TWE divest itself of lesser quality US brands to concentrate on becoming a global up-market wine producer with wineries in Australia, New Zealand, the US and Europe.
It has been a rollercoaster year for TWE.
The coronavirus pandemic saw consumer spending on discretionary goods such as wines dry up. Then, in November, the wine industry was hit by “anti-dumping” tariffs of 200 per cent by the Chinese Government in retaliation for Australia calling for a full investigation of the coronavirus origins.
That second whammy hurt the most.
Much of its premium wines, such as the Penfold Grange brand, are sold into China.
The market accounted for 30 per cent of TWE’s earnings in FY20 and two-thirds of its Asia-region earnings.
TWE’s revenue fell 7.1 per cent in FY20 to $2.68 billion, while its profit plummeted 38 per cent, to $260.8 million. TWE chief executive officer Tim Ford will be hoping the split into three divisions will unlock value in its wine portfolio.
2. The a2 Milk Company
Dairy processing
ASX CODE A2M
MARKET CAPITALISATION 2021 $7,827.08
MARKET CAPITALISATION 2020 $11,093.40
REVENUE FY20 $1,610.39
REVENUE FY19 $1,256.74
NET PROFIT (LOSS) FY20 $357.60
NET PROFIT (LOSS) FY19 $277.02
THE a2 Milk Company was clearly the biggest agribusiness on the ASX last year. But the milk company lost its crown in recent months after a big slide in its share price.
The company’s disclosure on December 18 that it had got its China sales forecasts for infant nutrition horribly wrong sent its share price over a cliff, from $13.29 to $10.15 in a single day. The admission wiped about $2 billion off its market capitalisation almost overnight. To put that into perspective, $2 billion is greater than the market capitalisation of most of the top 10 agribusinesses on the ASX.
The disclosure sullied an otherwise impressive performance in a year where most companies were hit hard by the coronavirus pandemic.
The a2 Milk Company was one of the few listed agribusinesses on the ASX to weather the March 2020 sharemarket collapse. In fact, it was barely a blip on the radar, with the company’s share price rising from $16 a share 12 months ago to hit a record of $20.20 in July – translating into a $15 billion company.
But then the company began to question its sales forecasts. By December, a2 acknowledged assumptions made on its earlier forecasts were faulty and the key daigou trade – visitors and students buying product to send back to China – was not panning out the way it thought it was. Daigous represent a significant proportion of its infant nutrition sales in Australia and New Zealand.
The share price spiralled downwards and by mid-February had fallen below $10 – less than half its value of last July.
There are recent signs of a slow but steady climb in its share price.

3. Incitec Pivot
Fertiliser production
ASX CODE IPL
MARKET CAPITALISATION 2021 $4,955.71
MARKET CAPITALISATION 2020 $4,678.98
REVENUE FY20 $3,942.20
REVENUE FY19 $3,918.20
NET PROFIT (LOSS) FY20 $123.40
NET PROFIT (LOSS) FY19 $152.10
FERTILISER and explosives manufacturer Incitec Pivot Limited was already heading for a dive when COVID-19 hit. Its shares bottomed out at $1.50 and have largely traded around $2 for much of the year.
Early this year, the shares recovered and were trading recently at about $2.60.
It remains firmly ensconced in third spot on the top 50 ASX-listed agribusinesses.
IPL’s net revenue remained relatively unchanged at $3.9 billion in FY20, but its profit fell 19 per cent to $123 million. It did not pay a dividend during the past year.
The fertiliser division now plays second fiddle to the explosives sector of the company.
In FY20, fertiliser accounted for a meagre 6 per cent of total earnings before interest and tax.
In FY19, IPL announced it was reviewing the fertiliser division, with the options being to sell it off, demerge it into a separate company or hang on to it and invest further in the business. The company’s board decided during the past year to keep the fertiliser division and expand its products.
The fertiliser business is highly dependent on seasonal conditions. When drought hits, farmers spend less on crop and pasture nutrition. After posting a loss in the fertiliser division in FY19 as a result of drought on the eastern seaboard, IPL recorded earnings of $26 million last year. Fertiliser sales volumes rose 14 per cent to 2.2 million tonnes in FY20, as the season on the east coast of Australia turned out to be one of the best on record.
IPL is looking to boost fertiliser distribution through combining soil testing and precision farming, and new products, such as liquid fertilisers and efficiency-enhanced fertilisers.
4. Costa Group Holdings
Horticultural production
ASX CODE CGC
MARKET CAPITALISATION 2021 $1,763.48
MARKET CAPITALISATION 2020 $1,152.28
REVENUE FY20 $1,164.90
REVENUE FY19 $1,047.87
NET PROFIT (LOSS) FY20 $65.20
NET PROFIT (LOSS) FY19 ($29.70)
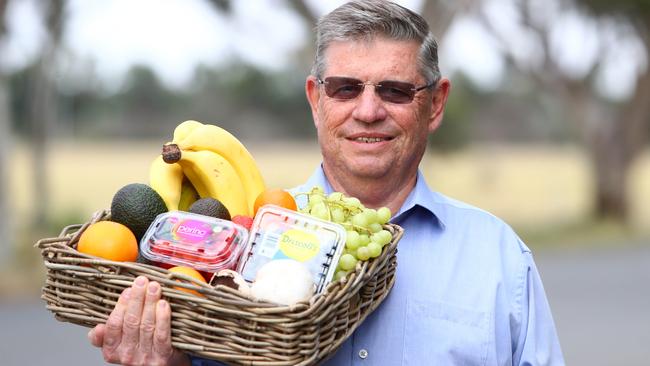
COSTA Group Holdings has overcome drought and other setbacks during the past two years to lodge a healthy $65.2 million after-tax profit for the 12 months to December 31, 2020.
The big turnaround in Costa Group’s fortunes means managing director Harry Debney leaves the horticultural company on a high note at the end of March. His retirement sees the baton handed over to second-in-command Sean Hallahan in a seamless transition.
The company has a diversified fruit and vegetable portfolio covering Australia, Morocco and China, with all operations reporting positive results in 2020.
When it released its positive half-year results last August, Costa Group began rising up the top 50 chart from ninth spot to fourth this year.
Its share price bottomed out at $2.50 when global sharemarkets collapsed last March but has since risen 72 per cent to about $4.50.
During the year, it paid $4.5 million for a dried fruit property owned by Murray River Organics. It is also waiting to see the outcome of Macquarie Infrastructure and Real Assets’ bid for Vitalharvest.
Vitalharvest’s four berry and three citrus properties in NSW, Tasmania and South Australia are all leased by Costa Group.
Costa Group recently announced it was expanding its Sunraysia citrus operations to add another 700 hectares of trees, such was its confidence in the industry.
It was also beginning a full-scale rollout of trellised avocados at four times normal density under netting after a successful 2017 trial.

5. Bega Cheese
Dairy processing
ASX CODE BGA
MARKET CAPITALISATION 2021 $1,750.53
MARKET CAPITALISATION 2020 $878.40
REVENUE FY20 $1,493.33
REVENUE FY19 $1,432.71
NET PROFIT (LOSS) FY20 $21.30
NET PROFIT (LOSS) FY19 $11.82
BEGA Cheese is jumping into the big league of agribusinesses after buying Lion Dairy & Drinks for $534 million from Japanese owner Kirin in the past year.
The dairy company has now fashioned itself into a broader food company after buying the Vegemite and peanut butter labels from Mondelez International in 2017. Prior to that deal, Bega had revenue of $1.2 billion and net assets of $328 million.
After snaring the Lion portfolio of well-known dairy and fruit juice brands, such as Big M, Dare, Yoplait, Pura, Berri and Daily Juice Co., the company’s revenue is now expected to top $3 billion and its net assets $1.2 billion.
The Lion buyout has brought forward Bega’s strategy to become a food and beverage company by at least two years. The deal gives Bega significant diversity, helping to stabilise revenue.
Investors liked Bega Cheese’s move on Lion, happily piling in $400 million in a capital raising to help pay for the purchase, while not compromising its share price. The shares have now risen about 41 per cent since last March, almost doubling the company’s market capitalisation. It sat outside the top 10 last March but is now No. 5.
Bega Cheese can be expected to grow further. The dairy company’s corporate adviser David Williams, of Kidder Williams, says there are plenty more food and dairy assets either on the market now or about to come into play.
“So Bega has now got a $3 billion turnover and you could reasonably expect that to grow,” he says.
6. Elders
Real estate, farm merchandise, livestock, grain, finance services
ASX CODE ELD
MARKET CAPITALISATION 2021 $1,749.60
MARKET CAPITALISATION 2020 $1,265.62
REVENUE FY20 $2,092.62
REVENUE FY19 $1,667.35
NET PROFIT (LOSS) FY20 $124.20
NET PROFIT (LOSS) FY19 $70.70
BY ANY standards, Elders Limited has had a pretty stellar year.
Apart from a blip when global sharemarkets crashed last March, Elders’ share price has continued to climb and the company paid out relatively healthy dividends during the year. Its share price is now 55 per cent higher than what it was last March.
Only seven years ago, Elders was a basket case. Mark Allison was appointed chief executive and managing director in May 2014, and has turned the company around with a series of plans. Shares are now trading at 11-12 times what they were at that point.
The company completed its second eight-point plan last year. According to Allison, the crux of the plan was to develop a cost and capital base to “make good money in bad seasons and great money in good seasons”.
One of the best seasons across Australia saw Elders post a net profit after tax of $124.2 million, equalling its previous record.
“The goals of the second eight-point plan was to achieve a 20 per cent return on capital and 10 per cent growth. We achieved that by the end of 2020,” Allison says.
Elders is just beginning its third eight-point plan which will take the company through to 2023. Its shareholders told the company they would be happy over the long term for 5 per cent growth and more than 15 per cent return on capital.
Allison says Elders’ third plan centres on “winning market share, increasing its gross margins and enhancing its financial, feed processing and digital agtech services, while driving its sustainability agenda”.
The big question is: will the share price still climb this year on its current trajectory?

7. Nufarm
Agricultural chemical production
ASX CODE NUF
MARKET CAPITALISATION 2021 $1,708.89
MARKET CAPITALISATION 2020 $2,031.37
REVENUE FY20 $2,847.38
REVENUE FY19 $3,757.59
NET PROFIT (LOSS) FY20 ($456.10)
NET PROFIT (LOSS) FY19 $38.31
CROP protection company Nufarm has seen its fortunes slip this past year, mainly due to poor seasonal conditions in Europe slashing earnings and lower returns in North America.
The bottom line for FY20 was a net loss of $456 million after reporting a modest net profit of $38 million the previous year. It was a result Nufarm managing director Greg Hunt says was “disappointing” and “unacceptable”.
The share price is now sitting about 20 per cent lower than where it was a year ago, but it was enough to see Nufarm’s market capitalisation fall by about a third and, hence, the company slipped three places in the top 50 to end up at No. 7 this year.
COVID-19 had a relatively minor impact on the company’s finances this year. Much of Nufarm’s prosperity rests on seasonal conditions. While there was a turnaround in drought conditions in NSW and Queensland in Australia, farmers in France, Germany and the UK suffered a poor season.
Nufarm also suffered high raw material and logistics costs and increased pressure on margins in its European markets.
The importance of the major northern hemisphere markets cannot be understated.
Underlying earnings in Australia and New Zealand only amounted to about 13 per cent of total earnings in FY20, while Europe and North America each accounted for about a third.
During the year, Nufarm offloaded its South American chemicals business, allowing Nufarm to pay down its debt from $1.25 billion to $441 million. And its long-term investment in omega-3 canola oil is beginning to make headway, while its other seeds technology project, carinata, is also showing potential.
8. United Malt Group
Malt production
ASX CODE UMG
MARKET CAPITALISATION 2021 $1,145.86
MARKET CAPITALISATION 2020
REVENUE FY20 $1,293.60
REVENUE FY19
NET PROFIT (LOSS) FY20 $45.60
NET PROFIT (LOSS) FY19
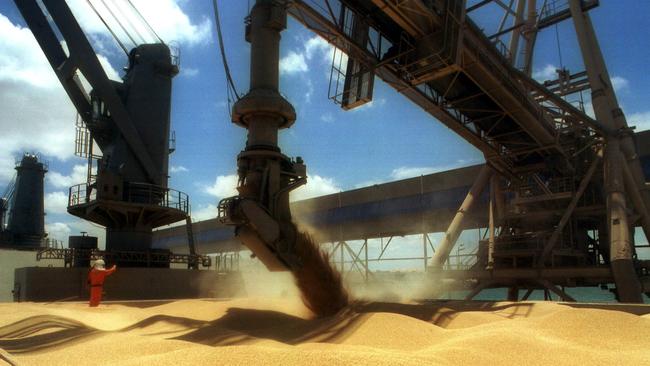
UNITED Malt Group emerged as an ASX-listed company in its own right last March when it was demerged from parent GrainCorp.
The company was built up in the 1990s by Canada Malting Company by progressively aggregating maltsters from the UK, Canada and the US, including 198-year-old Bairds Malt which began in Glasgow, Scotland.
Canada Malting Company was bought by Conagra Foods and Tiger Brands in 1995 which added Australian maltster Barrett Burston at the same time.
The conglomeration became United Malt Holdings in 2006 and was bought by GrainCorp three years later for $757 million as part of its diversification push. It was a smart move by GrainCorp as the millennium drought from 2001 proved the bulk handler’s reliance on its traditional income source – grain harvests – was a rocky road.
UMH became a backbone of GrainCorp’s business during the next decade and accounted for 22-32 per cent of revenue of the company. More importantly, since FY15, the malt division consistently provided GrainCorp with most of its earnings, as much as 63 per cent.
UMH was demerged from GrainCorp early last year to “unlock significant value for shareholders”. GrainCorp chairman Graham Bradley said at the time UMH’s full value had not been realised because it was part of a “broader group whose business is affected by the variability of weather and crop cycles in east coast Australia” – the exact reason why the bulk handler bought it. So far, it has not set the world alight, as its share price now is less than what it was at the demerger.

9. Inghams Group
Chicken grower and processing
ASX CODE ING
MARKET CAPITALISATION 2021 $1,356.63
MARKET CAPITALISATION 2020 $1,225.52
REVENUE FY20 $2,555.80
REVENUE FY19 $2,539.70
NET PROFIT (LOSS) FY20 $40.10
NET PROFIT (LOSS) FY19 $126.20
POULTRY producer and processor Inghams Group was recovering from a difficult beginning to FY20 when the coronavirus pandemic hit last March.
Chicken sales dropped away as consumer habits changed, and inventories built up, contributing to net debt jumping from $50.9 million to $314.7 million.
At the same time, the company had to adapt to market changes as consumer panic buying switched from deli to tray-pack products.
Ingham’s sales volume across Australia and New Zealand dropped by 5.8 per cent in the June quarter of last year.
But with Aussies one of the top five nationalities in the world for chicken munching, the tables soon turned; Inghams sales volume rose 7.5 per cent in the September quarter to land slightly below pre-COVID-19 levels.
During the past year, Inghams has increased its efficiencies by 10 per cent across its business.
Working in its favour is an expectation feed costs will fall this financial year with a bumper wheat crop in Australia this past harvest.
More recently, Inghams agreed to sell its dairy nutrition business in Hamilton, New Zealand, to SunRice Group for $NZ11.5 million ($A10.8 million) last December.
As it was solely a dairy feed operation, it was a non-core business.
Inghams delivered an after-tax profit of $40.1 million off revenue of $2.56 billion in FY20, which was slightly below the company’s expectations.
But it paid out dividends of 14c a share for the year.
10. GrainCorp
Grain bulk handling and malt production
ASX CODE GNC
MARKET CAPITALISATION 2021 $1,011.54
MARKET CAPITALISATION 2020 $1,872.04
REVENUE FY20 $4,287.20
REVENUE FY19 $4,780.00
NET PROFIT (LOSS) FY20 $343.30
NET PROFIT (LOSS) FY19 ($113.00)
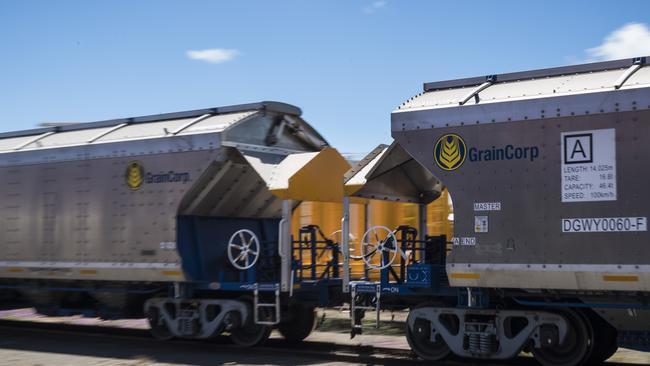
GRAINCORP has slipped down the top 50 list, from fifth last year to No. 10 in this year. But that was not due to a poor year, but rather a demerger of its profitable malting business into a separate listed company, United Malt Group.
The share price – which has generally traded at $8-$10 for much of the past decade – fell on March 23 last year when UMG listed on the ASX and also as global sharemarkets plummeted due to the coronavirus pandemic.
With the GrainCorp share price virtually halving from its pre-demerger levels, the company’s market capitalisation has fallen – hence, its ranking as well.
The company reported a post-tax profit of $343 million in FY20, but its underlying position was a net loss of $16 million.
The profit was due to proceeds from the demerger of UMG, plus a gain from the sale of the bulk liquid terminals business during the year.
GrainCorp’s fortunes have risen in the past year as a result of the breaking of a three-year drought in NSW and Queensland, with many farmers reporting record crop yields.
The Australian Bureau of Agricultural and Resource Economics and Sciences last month reported record grain production along the eastern seaboard during the past year of 33.1 million tonnes.
With this year’s summer crop harvest, GrainCorp is expecting grain receivals – its bread and butter income – to be a record 15.5-16.5 million tonnes.
Last August, GrainCorp entered into a partnership with the CSIRO, Woolworths and others to launch FutureFeed – a company set up to commercialise an innovative livestock feed additive made from seaweed designed to reduce methane gas emissions from cattle.
11. Synlait Milk
Dairy farming and processing
ASX CODE SM1
MARKET CAPITALISATION 2021 $865.58
MARKET CAPITALISATION 2020 $1,054.32
REVENUE FY20 $1,207.46
REVENUE FY19 $987.67
NET PROFIT (LOSS) FY20 $69.70
NET PROFIT (LOSS) FY19 $79.23
12. Rural Funds Group
Diverse agricultural investments
ASX CODE RFF
MARKET CAPITALISATION 2021 $782.87
MARKET CAPITALISATION 2020 $673.64
REVENUE FY20 $71.21
REVENUE FY19 $68.93
NET PROFIT (LOSS) FY20 $49.00
NET PROFIT (LOSS) FY19 $33.35
13. Australian Agricultural Company
Cattle and meat production
ASX CODE AAC
MARKET CAPITALISATION 2021 $694.39
MARKET CAPITALISATION 2020 $666.06
REVENUE FY20 $338.12
REVENUE FY19 $365.9
NET PROFIT (LOSS) FY20 $31.30
NET PROFIT (LOSS) FY19 ($148.40)
14. Select Harvests
Almond growing and processing
ASX CODE SHV
MARKET CAPITALISATION 2021 $643.56
MARKET CAPITALISATION 2020 $636.71
REVENUE FY20 $248.26
REVENUE FY19 $309.17
NET PROFIT (LOSS) FY20 $25.00
NET PROFIT (LOSS) FY19 $53.02

15. Ricegrowers Limited
Rice processing
ASX CODE SGL/SGLLV
MARKET CAPITALISATION 2021 $389.05
MARKET CAPITALISATION 2020 $241.87
REVENUE FY20 $1,134.82
REVENUE FY19 $1,193.06
NET PROFIT (LOSS) FY20 $22.70
NET PROFIT (LOSS) FY19 $32.77
16. Bubs Australia
Goat milk infant formula
ASX CODE BUB
MARKET CAPITALISATION 2021 $352.00
MARKET CAPITALISATION 2020 $403.41
REVENUE FY20 $55.02
REVENUE FY19 $45.15
NET PROFIT (LOSS) FY20 ($7.80)
NET PROFIT (LOSS) FY19 ($35.51)
17. Salt Lake Potash
Sulphate of potash mining
ASX CODE SO4
MARKET CAPITALISATION 2021 $347.23
MARKET CAPITALISATION 2020 $168.36
REVENUE FY20 $0.16
REVENUE FY19 $0.14
NET PROFIT (LOSS) FY20 ($15.60)
NET PROFIT (LOSS) FY19 ($26.90)
18. Ridley Corporation
Stockfeed sales
ASX CODE RIC
MARKET CAPITALISATION 2021 $309.91
MARKET CAPITALISATION 2020 $284.80
REVENUE FY20 $969.02
REVENUE FY19 $1,009.88
NET PROFIT (LOSS) FY20 ($8.50)
NET PROFIT (LOSS) FY19 $23.57

19. Ecofibre Limited
Industrial hemp production
ASX CODE EOF
MARKET CAPITALISATION 2021 $287.86
MARKET CAPITALISATION 2020 $311.14
REVENUE FY20 $57.2
REVENUE FY19 $37.47
NET PROFIT (LOSS) FY20 $13.20
NET PROFIT (LOSS) FY19 $6.00
20. Clover Corporation Limited
Omega 3 additives for infant formulas
ASX CODE CLV
MARKET CAPITALISATION 2021 $229.51
MARKET CAPITALISATION 2020 $445.71
REVENUE FY20 $88.23
REVENUE FY19 $77.40
NET PROFIT (LOSS) FY20 $12.50
NET PROFIT (LOSS) FY19 $10.10
21. Vitalharvest Freehold Trust
Citrus and berry production
ASX CODE VTH
MARKET CAPITALISATION 2021 $186.85
MARKET CAPITALISATION 2020 $133.20
REVENUE FY20 $16.13
REVENUE FY19 $18.30
NET PROFIT (LOSS) FY20 $10.70
NET PROFIT (LOSS) FY19 ($5.50)
22. Australian Vintage
Wine production
ASX CODE AVG
MARKET CAPITALISATION 2021 $182.46
MARKET CAPITALISATION 2020 $131.93
REVENUE FY20 $267.14
REVENUE FY19 $270.11
NET PROFIT (LOSS) FY20 $11.00
NET PROFIT (LOSS) FY19 $8.12
23. Kalium Lakes
Sulphate of potash mining
ASX CODE KLL
MARKET CAPITALISATION 2021 $172.03
MARKET CAPITALISATION 2020 $190.08
REVENUE FY20 $0.64
REVENUE FY19 $1.71
NET PROFIT (LOSS) FY20 ($18.90)
NET PROFIT (LOSS) FY19 ($11.80)
24. Duxton Water
Water trading
ASX CODE D20
MARKET CAPITALISATION 2021 $161.46
MARKET CAPITALISATION 2020 $161.35
REVENUE FY20 N/A
REVENUE FY19 $28.20
NET PROFIT (LOSS) FY20 N/A
NET PROFIT (LOSS) FY19 $7.27

25. Agrimin
Sulphate of potash mining
ASX CODE AMN
MARKET CAPITALISATION 2021 $118.45
MARKET CAPITALISATION 2020 $76.51
REVENUE FY20 $0.21
REVENUE FY19 $0.24
NET PROFIT (LOSS) FY20 ($1.80)
NET PROFIT (LOSS) FY19 ($1.79)
26. Lindsay Australia Limited
Transport and logics for agriculture
ASX CODE LAU
MARKET CAPITALISATION 2021 $106.34
MARKET CAPITALISATION 2020 $109.05
REVENUE FY20 $425.11
REVENUE FY19 $389.82
NET PROFIT (LOSS) FY20 $5.30
NET PROFIT (LOSS) FY19 $8.88
27. Australian Potash Limited
Potash mining
ASX CODE APC
MARKET CAPITALISATION 2021 $93.44
MARKET CAPITALISATION 2020 $33.28
REVENUE FY20 $1.96
REVENUE FY19 $2.31
NET PROFIT (LOSS) FY20 ($0.80)
NET PROFIT (LOSS) FY19 $0.14

28. Maggie Beer Holdings
Dairy production and retail sales
ASX CODE MBH
MARKET CAPITALISATION 2021 $88.22
MARKET CAPITALISATION 2020 $31.07
REVENUE FY20 $45.56
REVENUE FY19 $25.75
NET PROFIT (LOSS) FY20 ($14.80)
NET PROFIT (LOSS) FY19 ($24.16)
29. Apiam Animal Health
Veterinary services
ASX CODE AHX
MARKET CAPITALISATION 2021 $82.71
MARKET CAPITALISATION 2020 $50.38
REVENUE FY20 $118.42
REVENUE FY19 $111.74
NET PROFIT (LOSS) FY20 $4.30
NET PROFIT (LOSS) FY19 $3.15
30. Terragen
Soil and animal health biotech services
ASX CODE TGH
MARKET CAPITALISATION 2021 $81.35
MARKET CAPITALISATION 2020 $30.83
REVENUE FY20 $2.03
REVENUE FY19 $0.98
NET PROFIT (LOSS) FY20 ($4.90)
NET PROFIT (LOSS) FY19 ($3.21)
31. Wide Open Agriculture
Regenerative vegetable, beef, lamb and
hemp food processing *
ASX CODE WOA
MARKET CAPITALISATION 2021 $64.88
MARKET CAPITALISATION 2020 $8.82
REVENUE FY20 $1.94
REVENUE FY19 $0.31
NET PROFIT (LOSS) FY20 ($1.90)
NET PROFIT (LOSS) FY19 ($2.08)
32. Duxton Broadacre Farms
Grain crop and livestock production
ASX CODE DBF
MARKET CAPITALISATION 2021 $58.81
MARKET CAPITALISATION 2020 $47.68
REVENUE FY20 $12.64
REVENUE FY19 $13.62
NET PROFIT (LOSS) FY20 ($1.50)
NET PROFIT (LOSS) FY19 ($1.12)
33. Keytone Dairy Corporation
Milk powder production
ASX CODE KTD
MARKET CAPITALISATION 2021 $57.73
MARKET CAPITALISATION 2020 $69.91
REVENUE FY20 $22.70
REVENUE FY19 $2.68
NET PROFIT (LOSS) FY20 ($7.70)
NET PROFIT (LOSS) FY19 ($3.29)
34. Beston Global
Dairy, meat and seafood exporting
ASX CODE BFC
MARKET CAPITALISATION 2021 $55.62
MARKET CAPITALISATION 2020 $36.27
REVENUE FY20 $103.17
REVENUE FY19 $86.03
NET PROFIT (LOSS) FY20 ($12.20)
NET PROFIT (LOSS) FY19 ($27.32)

35. Nuchev
Goat milk infant formula
ASX CODE NUC
MARKET CAPITALISATION 2021 $48.66
MARKET CAPITALISATION 2020 $134.10
REVENUE FY20 $17.70
REVENUE FY19 $9.50
NET PROFIT (LOSS) FY20 ($10.90)
NET PROFIT (LOSS) FY19 ($9.70)
36. Namoi Cotton
Cotton production
ASX CODE NAM
MARKET CAPITALISATION 2021 $48.48
MARKET CAPITALISATION 2020 $46.30
REVENUE FY20 N/A
REVENUE FY19 $5.95
NET PROFIT (LOSS) FY20 N/A
NET PROFIT (LOSS) FY19 ($0.56)
37. Jatenergy Limited
Milk powder production
ASX CODE JAT
MARKET CAPITALISATION 2021 $45.81
MARKET CAPITALISATION 2020 $45.79
REVENUE FY20 $59.45
REVENUE FY19 $66.44
NET PROFIT (LOSS) FY20 ($26.59)
NET PROFIT (LOSS) FY19 ($20.49)
38. Wellard
Cattle exports
ASX CODE WLD
MARKET CAPITALISATION 2021 $40.91
MARKET CAPITALISATION 2020 $34.53
REVENUE FY20 $87.60
REVENUE FY19 $235.09
NET PROFIT (LOSS) FY20 $0.25
NET PROFIT (LOSS) FY19 ($48.44)

39. Australian Primary Hemp
Industrial hemp production
ASX CODE APH
MARKET CAPITALISATION 2021 $35.07
MARKET CAPITALISATION 2020 $7.67
REVENUE FY20 $1.16
REVENUE FY19 $0.90
NET PROFIT (LOSS) FY20 ($5.90)
NET PROFIT (LOSS) FY19 ($1.36)
40. Health and Plant Protein Group
Ginger and macadamia production
ASX CODE HPP
MARKET CAPITALISATION 2021 $35.00
MARKET CAPITALISATION 2020 $20.64
REVENUE FY20 $42.12
REVENUE FY19 $76.17
NET PROFIT (LOSS) FY20 ($7.60)
NET PROFIT (LOSS) FY19 ($0.24)
41. Reward Minerals
Sulphate of potash mining
ASX CODE RWD
MARKET CAPITALISATION 2021 $28.06
MARKET CAPITALISATION 2020 24.38
REVENUE FY20 N/A
REVENUE FY19 1.68
NET PROFIT (LOSS) FY20 N/A
NET PROFIT (LOSS) FY19 0.61

42. Australian Dairy Nutritionals Group
Dairy farming and processing
ASX CODE AHF
MARKET CAPITALISATION 2021 $27.80
MARKET CAPITALISATION 2020 $32.65
REVENUE FY20 $24.09
REVENUE FY19 $21.94
NET PROFIT (LOSS) FY20 ($7.50)
NET PROFIT (LOSS) FY19 ($4.03)
43. Wingara Ag
Agricultural product processing
ASX CODE WNR
MARKET CAPITALISATION 2021 $21.91
MARKET CAPITALISATION 2020 $28.10
REVENUE FY20 $35.06
REVENUE FY19 $29.26
NET PROFIT (LOSS) FY20 $0.80
NET PROFIT (LOSS) FY19 $0.91
44. Bio-Gene Technology
Insecticide development
ASX CODE BGT
MARKET CAPITALISATION 2021 $20.47
MARKET CAPITALISATION 2020 $23.92
REVENUE FY20 $1.13
REVENUE FY19 $0.66
NET PROFIT (LOSS) FY20 ($1.90)
NET PROFIT (LOSS) FY19 ($2.06)

45. Murray River Organics
Horticultural production
ASX CODE MRG
MARKET CAPITALISATION 2021 $15.00
MARKET CAPITALISATION 2020 $50.42
REVENUE FY20 $48.81
REVENUE FY19 $60.07
NET PROFIT (LOSS) FY20 ($39.10)
NET PROFIT (LOSS) FY19 ($12.04)

46. Farm Pride Foods
Egg production
ASX CODE FRM
MARKET CAPITALISATION 2021 $14.90
MARKET CAPITALISATION 2020 $16.00
REVENUE FY20 $90.33
REVENUE FY19 $86.64
NET PROFIT (LOSS) FY20 ($2.20)
NET PROFIT (LOSS) FY19 ($3.86)
47. Roots Sustainable Agricultural Technologies
Precision ag technology provider
ASX CODE ROO
MARKET CAPITALISATION 2021 $12.42
MARKET CAPITALISATION 2020 $4.01
REVENUE FY20 N/A
REVENUE FY19 $0.31
NET PROFIT (LOSS) FY20 N/A
NET PROFIT (LOSS) FY19 ($2.99)
48. Centrex Metals
Phosphate rock mining
ASX CODE CXM
MARKET CAPITALISATION 2021 $11.36
MARKET CAPITALISATION 2020 $12.94
REVENUE FY20 $0.06
REVENUE FY19 $0.28
NET PROFIT (LOSS) FY20 ($19.80)
NET PROFIT (LOSS) FY19 ($1.38)
49. Trigg Mining
Sulphate of potash miner
ASX CODE TMG
MARKET CAPITALISATION 2021 $8.40
MARKET CAPITALISATION 2020 $2.90
REVENUE FY20 $0.16
REVENUE FY19 $0.31
NET PROFIT (LOSS) FY20 ($3.50)
NET PROFIT (LOSS) FY19 ($1.08)
50. Australian Agricultural Projects
Olive production
ASX CODE AAP
MARKET CAPITALISATION 2021 $7.62
MARKET CAPITALISATION 2020 $1.82
REVENUE FY20 $1.13
REVENUE FY19 $2.45
NET PROFIT (LOSS) FY20 ($1.70)
NET PROFIT (LOSS) FY19 ($0.50)

