
Mapped: The Qld suburbs voting ‘yes’ and ‘no’
Just three electorates in Queensland are on track to vote in support of The Voice on Saturday, according to new seat-by-seat analysis.
QLD News
Don't miss out on the headlines from QLD News. Followed categories will be added to My News.
Just three electorates in Queensland are on track to vote in support of a Voice to Parliament in the referendum on Saturday, according to a seat-by-seat analysis by UK-based data company focaldata.
It is a blow to the “yes” campaign, with the sunshine state running the highest opposition to the Voice of any state or territory.
Using statistical techniques that have been previously used to predict individual seat outcomes in the last Australian and British elections, the firm found a majority of voters intended to vote “yes” in just 22 electorates across the country.
Overall, the poll found the “no” side leading 61-39, in line with the most recent Newspoll which saw support for the “yes” case falling to just 34 per cent.
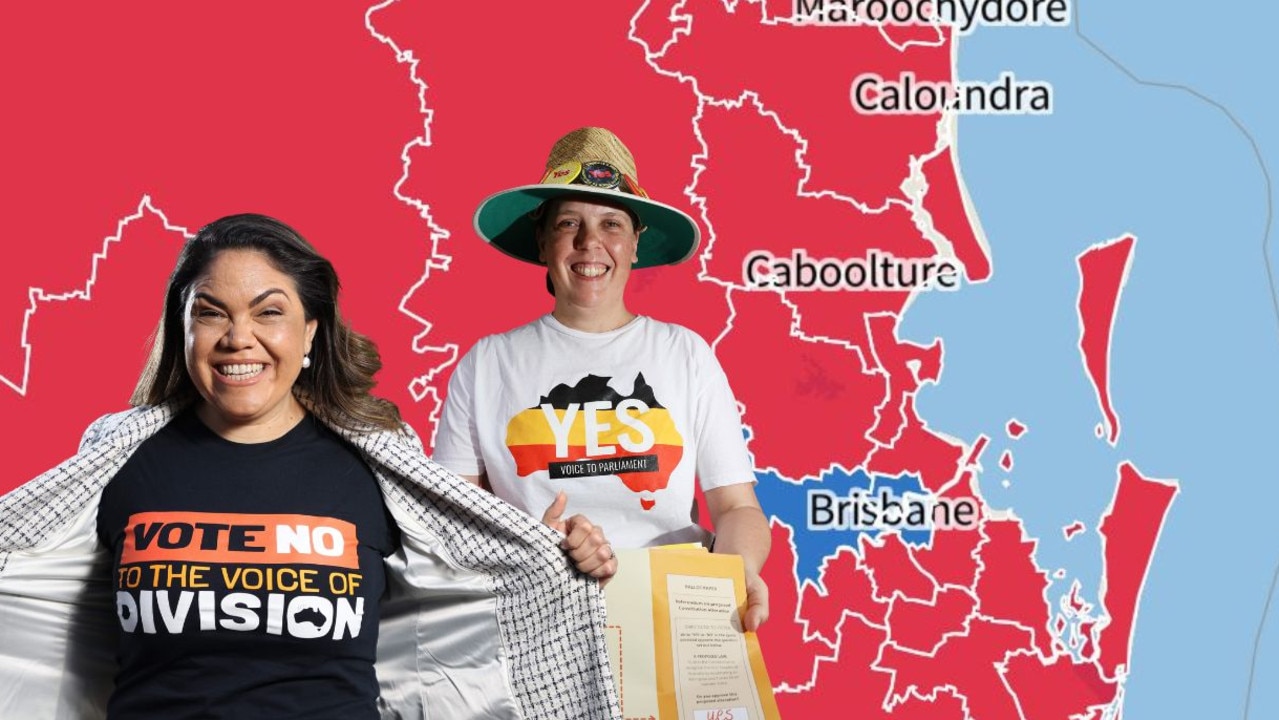
In Queensland, the only seats tracking to vote “yes”, according to the analysis, were Brisbane, Griffith and Ryan.
All three seats are in Brisbane’s inner city and are currently held by Greens MPs Stephen Bates, Max Chandler-Mather and Elizabeth Watson-Brown.
Regional seats in particular were set to strongly vote “no”.
Kennedy, which includes Mt Isa, Charters Towers, Mareeba and Doomadgee, and Maranoa, which includes Winton, Barcaldine Western Downs and Goondiwindi, were both expected to have a “no” vote of more than 80 per cent.
Capricornia, which includes Rockhampton; Dawson, which includes Mackay; Flynn, which includes Gladstone; and Hinkler, which includes Bundaberg, were all tracking to have a 75 per cent “no” vote.
Further south however, electorates in the state’s second biggest city, the Gold Coast, are also firmly in the “no” camp, with more than 70 per cent of voters in Moncrieff and Fadden set to vote “no”, while in McPherson the “no” vote is sitting at 67.1 per cent and in Forde it’s 69 per cent.
Back in Brisbane, the electorates with the biggest expected “no” votes are expected to be Bonner (60 per cent) and Bowman (71 per cent).
While other electorates are teetering on the edge: Lilley 54 per cent “no”, Moreton 51 per cent “no” and Ryan 49 per cent.
In NSW, rural and regional seats such as Farrer, Riverina, Calare, and Lyne saw the least support for the Voice, with the “no” case polling in the high 60s or low 70s.
The largest “no” vote numbers were seen in Calare, which takes in regional centres like Mudgee, Bathurst, and Lithgow, with a “no” vote of 72.3 per cent indicated.
In worrying news for the “yes” camp, support for the referendum was also soft in many so-called “teal” seats.
Wentworth, according to the analysis, just barely tipped into the “yes” column at 50.4 per cent.
Other seats such as Warringah and Mackellar polled even worse for “yes”, at around 55 and 62 per cent respectively.
Prime Minister Anthony Albanese’s inner-west seat of Grayndler, saw the second highest support in the poll, with around 64.5 per cent of locals anticipated to vote “yes”.
The only seat with an expected higher turnout for “yes” was neighbouring Sydney, held by environment minister Tanya Plibersek, with an expected 70 per cent of locals expected to support the referendum at the polls this Saturday.
The poll used a statistical technique called “MRP” that took data from 4500 respondents and then analysed answers against a database of 350,000 individual demographic “cells” to extract seat-by-seat results.
In a briefing note, the firm said “(Mr Albanese) has traded a diffuse, ideologically heterodox coalition for a vote that largely tracks density and age lines.
“It leaves Australia more divided than ever on an inner-city versus rural basis. More broadly, it’s a fallout which could have been lifted straight from the U.K. Brexit analysis – except the ‘Yes’ side does materially worse than Remain.”
James Kangasooriam, chief research officer of focaldata, said the resemblance to the 1999 referendum question on changing the preamble of the Constitution was uncanny.
“The patterns look starkly similar to the 1999 preamble vote – which coincidentally also polled 61:39.”
More Coverage


Originally published as Mapped: The Qld suburbs voting ‘yes’ and ‘no’
Join the conversation

Boyfriend driver on drugs day of Courtney’s hwy death, police allege
The boyfriend of young Qld woman, who ended up out of a moving HiLux and on the Bruce Highway where she died, was allegedly under the influence the day of the fateful trip, it can be revealed.
Read more
Teen boy seriously injured in e-bike crash
A teenage boy has suffered serious leg and head injuries on the Sunshine Coast after being hit by a car while riding his e-bike.
Read more
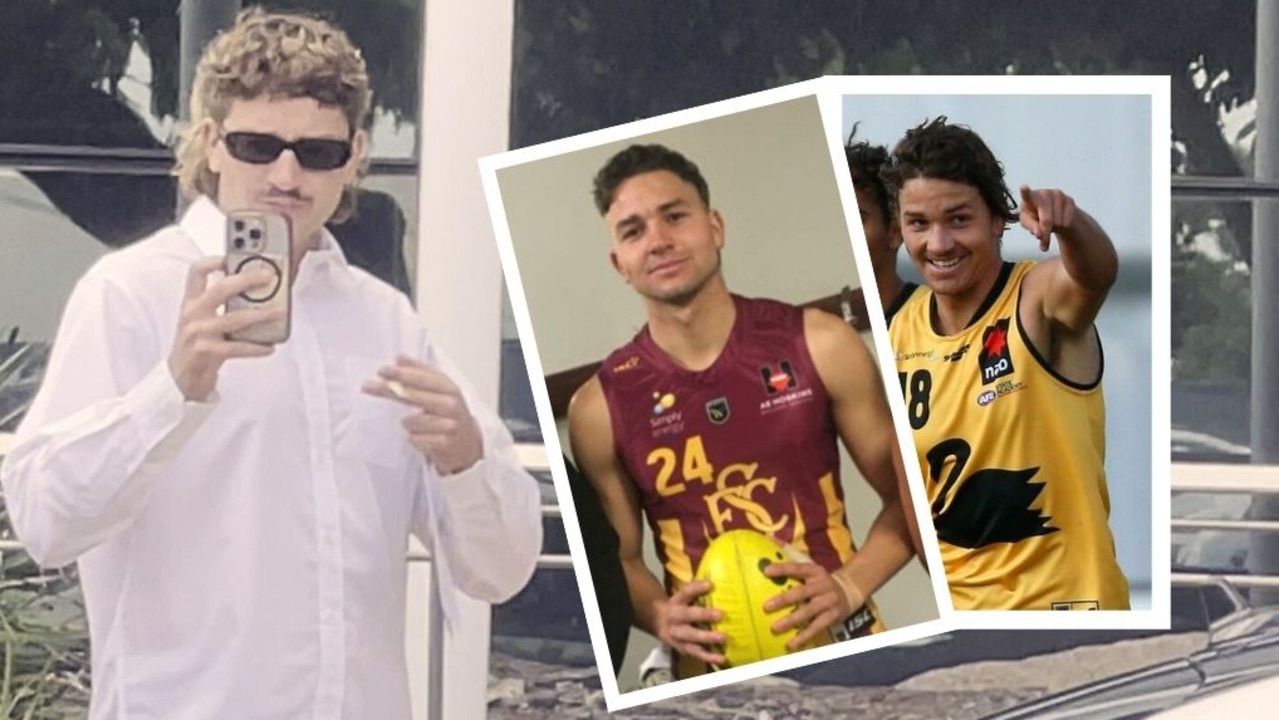
AFL star allegedly punched, broke man’s jaw at Burleigh Heads
An AFL young gun has been charged after a former NRL star’s nephew was allegedly assaulted and left in hospital with a broken jaw. Read the latest
Read more

‘Just want her to be remembered’: Dad’s touching vow to shark attack victim
The father of a 17-year-old shark attack victim has held back tears as he talked about his daughter’s legacy.
Read more
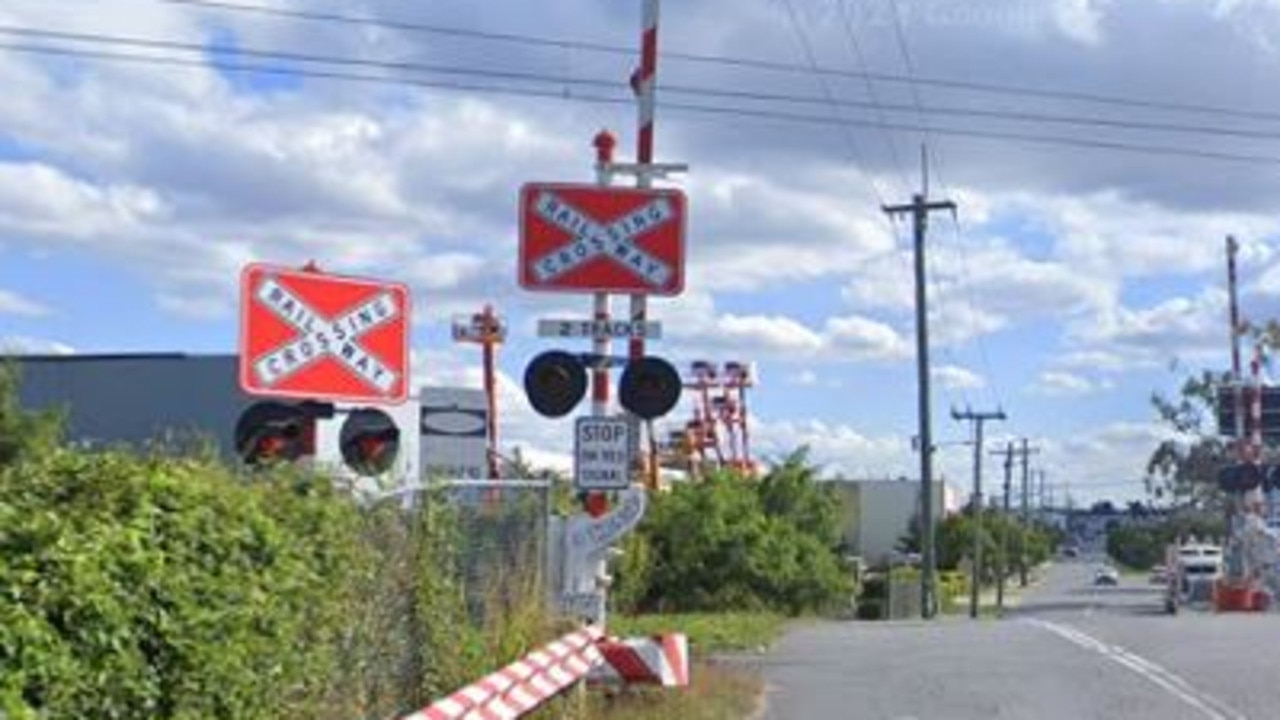
Road reopens after truck crash in Brisbane’s south
A level crossing in Brisbane’s south has reopened days after a truck crashed into a boom gate.
Read more
Delays overshadow Metro first-week passenger bonanza
Passenger figures for Metro’s first week has proved Brisbanites love it, with patronage surging, but ongoing issues with delays are likely to continue. Here’s why.
Read more