
Gold Digger: As gold demand rises, here’s how you find an outperformer
Gold is tipped to remain strong as inflows to ETFs surged in April, but which miners does Goldman Sachs see outperforming?

Stockhead
Don't miss out on the headlines from Stockhead. Followed categories will be added to My News.
Gold ETF inflows soared in April, driven by Chinese investors
State Street sees "bull case" of US$3500-3900/oz in 2025
Goldman Sachs surveys Australia's best performing gold miners
Gold may have taken a tumble last night amid signs of normalisation in the US trade universe – a deal between the US and UK that keeps a 10% tariff in place but gives concessions for beef, steel and more – but even with a deal with China on the cards, asset managers remain gold bulls.
At over US$3300/oz, gold prices still clock in at over $5000/oz for Aussie miners, with exchange rates also in their favour.
Figures for April from the World Gold Council, following up the strongest first quarter since 2016 continue to show the demand from investors for the yellow metal.
ETFs recorded a fifth straight month of net inflows, adding US$11 billion in April, with global holdings lifting 115t to 3561t.
That's the highest level of gold held in global ETFs since August 2022 but 10% below the month-end record of 3915t in October 2020.
Intriguingly, it was Asian buyers that provided the most steam for the engine, accounting for 65% of net inflows.
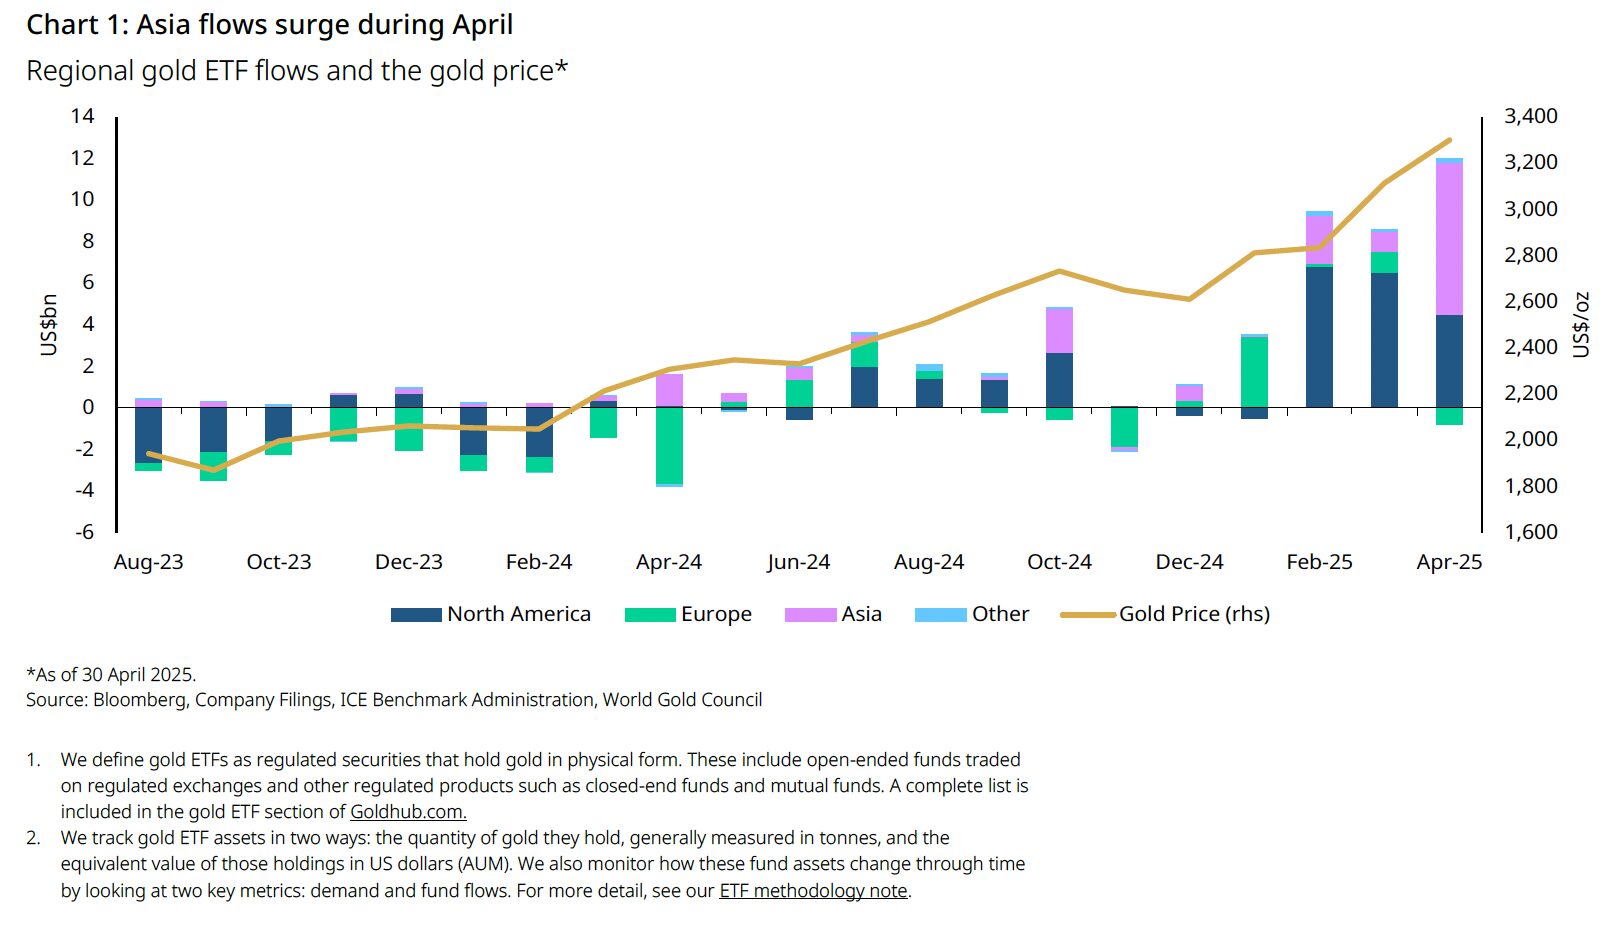
Over US$378bn of assets under management are now held in ETFs, with Asian funds' US$7.3bn of inflows in the month of April the strongest on record, led strongly by China.
"The bulk of the demand came from China (Table 2), marking the third consecutive month of inflows and the strongest on record for the region. And more impressively, the April inflows have now surpassed those in Q1 and in full year 2024," the WGC said.
"In addition to the continued local gold price surge, demand was also driven by:
- The ongoing trade dispute with the US, which has raised fears of weaker growth, amplified equity volatility, and intensified expectations of the local currency depreciation
- Lower government bond yields, amid rising rate cut anticipations."
US ETFs added US$4.5bn, their second highest on record.
Despite the pause after gold prices hit a brief record of US$3500/t in the days post-tariff in April, forecasters continue to tip higher levels.
State Street Global Advisors say "there is a strong tactical and strategic case to be made that the gold market has transitioned to a higher price regime north of US$3000/oz."
They've loaded up a new baseline floor price of US$3000-3100/oz, with a base case of US$3100-3500/oz for 2025.
The bull case for H2 has been moved up to an even stronger US$3500-3900/oz.
"An extended global trade war – even if isolated to US-China – should buttress demand for gold as a haven and alt-fiat asset," State Street says.
Despite the recent move down they say post-Liberation Day trade policies have 'enhanced the case for gold investment'.
Are all gold stocks a good bet?
A rising tide may float all boats.
But not to the same level.
Goldman Sachs' Aussie analysts Hugo Nicolaci, Paul Young, Marcus Dosanjh and Isaac Brooke have put together a catalogue of measurements to assess the outperformers in the ASX mid and large caps.
Their most recent note extends GS' analysis to over 45 listed gold assets covering more than 85% of gold production in Australia by names listed here and offshore.
There are a few market-specific trends which Goldman, on record as like equities above spot gold for value at the moment, has noted across the sector.
"At a sector-level, we find AISC/cash cost increases continued to moderate in the Mar-25 Q, though UG mining costs continue to rise," they said.
"While costs remain well above PcP levels, we expect further moderation of nominal cost increases, affirmed by our recent Perth trip seeing >25 corporates (mostly gold) with labour cost inflation seen at ~2-3% (and turnover for some falling to ~5-10%, from ~20-40% Covid peaks, improving productivity), softening oil/diesel prices, and unit costs further supported by grade improvements and growth projects adding to produced ounces."
When it comes to companies, they like Capricorn Metals (ASX:CMM), citing "peer-leading cost performance" in both open pit mining and processing at the Karlawinda gold mine "adding a defensive buffer to our preferred mid-cap gold exposure".
Gold Road Resources (ASX:GOR), which just agreed to a $3.7bn takeover by its JV partner at the Gruyere gold mine, Gold Fields, is viewed as having strong cash cost performance, while Newmont Corporation (ASX:NEM) (buy) and Evolution Mining (ASX:EVN) (neutral) have the benefit of copper by-products that support their cost base.
Northern Star Resources (ASX:NST) is also rated by Goldman as a buy, with strip ratios coming down at the Super Pit in Kalgoorlie and a wall remediation that cut off access to high grade ore deep in the big hole now complete.
A number of mid-cap names also look attractive on their higher than reserve grade mining performance.
Regis Resources (ASX:RRL), notably, has been seeing improved steadily improving grades that are outperforming reserves, Goldman's analysts noted. GS remains sell rated on Regis however, with its $4.25 price target tracking well below the current market price of $4.82.
Winners & Losers
Here’s how ASX-listed precious metals stocks are performing:
| CODE | COMPANY | PRICE | WEEK % | MONTH % | 6 MONTH % | YEAR % | YTD % | MARKET CAP |
|---|---|---|---|---|---|---|---|---|
| MRR | Minrex Resources Ltd | 0.0085 | 6% | 6% | 0% | -23% | 21% | $ 8,678,940.02 |
| NPM | Newpeak Metals | 0.013 | 8% | 30% | 8% | -31% | 18% | $ 3,864,860.77 |
| ASO | Aston Minerals Ltd | 0.017 | 0% | 21% | 70% | 55% | 89% | $ 24,606,221.11 |
| MTC | Metalstech Ltd | 0.125 | 25% | 26% | -14% | -51% | -11% | $ 25,046,595.12 |
| GED | Golden Deeps | 0.02 | 11% | 5% | -34% | -50% | -20% | $ 3,188,262.62 |
| G88 | Golden Mile Res Ltd | 0.011 | 0% | 38% | -12% | 0% | 22% | $ 6,530,974.26 |
| LAT | Latitude 66 Limited | 0.047 | -16% | -15% | -53% | -77% | 24% | $ 6,739,833.14 |
| NMR | Native Mineral Res | 0.18 | -3% | 82% | 414% | 847% | 362% | $ 159,001,115.22 |
| AQX | Alice Queen Ltd | 0.006 | 0% | 33% | -25% | 0% | -25% | $ 6,881,340.41 |
| SLZ | Sultan Resources Ltd | 0.006 | -14% | -14% | -33% | -45% | 0% | $ 1,388,819.46 |
| KSN | Kingston Resources | 0.089 | -1% | 13% | -6% | 24% | 25% | $ 76,441,805.98 |
| AMI | Aurelia Metals Ltd | 0.32 | 10% | 49% | 78% | 73% | 88% | $ 533,160,381.60 |
| GIB | Gibb River Diamonds | 0.035 | -10% | 3% | -5% | 46% | -13% | $ 7,936,849.47 |
| KCN | Kingsgate Consolid. | 2.08 | 25% | 48% | 49% | 31% | 62% | $ 530,968,485.52 |
| TMX | Terrain Minerals | 0.003 | 0% | 0% | -25% | -25% | 0% | $ 6,675,669.80 |
| BNR | Bulletin Res Ltd | 0.076 | 12% | 62% | 81% | 52% | 95% | $ 22,608,225.87 |
| NXM | Nexus Minerals Ltd | 0.073 | 1% | 4% | 35% | 3% | 62% | $ 45,281,970.98 |
| SKY | SKY Metals Ltd | 0.048 | -4% | 14% | 0% | 23% | -11% | $ 34,113,751.97 |
| LM8 | Lunnonmetalslimited | 0.215 | 0% | 16% | -32% | -31% | -14% | $ 48,538,198.28 |
| CST | Castile Resources | 0.075 | 0% | 4% | -4% | -18% | -6% | $ 22,931,143.50 |
| YRL | Yandal Resources | 0.18 | 24% | 57% | -47% | 64% | 3% | $ 55,662,296.76 |
| FAU | First Au Ltd | 0.003 | 20% | 50% | 50% | 50% | 50% | $ 6,215,979.83 |
| ARL | Ardea Resources Ltd | 0.42 | -5% | 11% | 6% | -36% | 27% | $ 87,321,359.73 |
| GWR | GWR Group Ltd | 0.115 | 24% | 35% | 34% | 5% | 44% | $ 35,596,732.05 |
| IVR | Investigator Res Ltd | 0.022 | -4% | 5% | -48% | -57% | 10% | $ 36,544,230.20 |
| GTR | Gti Energy Ltd | 0.003 | 0% | 0% | -25% | -40% | -14% | $ 8,996,848.99 |
| IPT | Impact Minerals | 0.006 | 0% | 50% | -47% | -74% | -36% | $ 22,215,979.58 |
| BNZ | Benzmining | 0.385 | 1% | 13% | 33% | 148% | 12% | $ 60,463,801.50 |
| MOH | Moho Resources | 0.004 | 0% | 14% | -43% | -20% | -20% | $ 2,923,498.30 |
| BCM | Brazilian Critical | 0.009 | 0% | 29% | 0% | -64% | 0% | $ 9,566,627.29 |
| PUA | Peak Minerals Ltd | 0.013 | 44% | 30% | 123% | 439% | 68% | $ 36,495,176.77 |
| MRZ | Mont Royal Resources | 0.041 | 0% | 0% | -9% | -23% | -5% | $ 3,486,221.51 |
| SMS | Starmineralslimited | 0.025 | -4% | 0% | -44% | -11% | -31% | $ 3,795,166.33 |
| MVL | Marvel Gold Limited | 0.015 | 7% | 25% | 25% | 67% | 67% | $ 15,116,337.31 |
| PRX | Prodigy Gold NL | 0.002 | 0% | 33% | -33% | -10% | 0% | $ 6,350,111.10 |
| AAU | Antilles Gold Ltd | 0.004 | 0% | 0% | 33% | -64% | 33% | $ 8,505,470.73 |
| CWX | Carawine Resources | 0.097 | 1% | -8% | -16% | -8% | -3% | $ 22,904,168.55 |
| RND | Rand Mining Ltd | 1.91 | 1% | 11% | -3% | 22% | 26% | $ 108,633,085.51 |
| CAZ | Cazaly Resources | 0.016 | 0% | 7% | 14% | -6% | 14% | $ 6,919,544.87 |
| BMR | Ballymore Resources | 0.145 | 16% | 32% | 7% | 4% | 21% | $ 28,276,893.60 |
| DRE | Dreadnought Resources Ltd | 0.014 | 0% | 17% | -13% | -18% | 17% | $ 67,821,635.90 |
| ZNC | Zenith Minerals Ltd | 0.044 | -2% | -20% | 0% | -41% | 10% | $ 18,334,863.99 |
| REZ | Resourc & En Grp Ltd | 0.019 | -10% | -21% | -34% | 46% | -17% | $ 13,432,782.44 |
| LEX | Lefroy Exploration | 0.08 | 1% | 1% | 5% | -20% | 14% | $ 18,879,930.49 |
| ERM | Emmerson Resources | 0.14 | 0% | 17% | 122% | 180% | 82% | $ 95,342,831.85 |
| AM7 | Arcadia Minerals | 0.018 | 0% | 20% | -49% | -75% | -5% | $ 2,112,901.79 |
| ADT | Adriatic Metals | 3.9 | -6% | 3% | -6% | -12% | 0% | $ 1,185,253,699.50 |
| AS1 | Asara Resources Ltd | 0.04 | -15% | -15% | 100% | 233% | 111% | $ 51,204,769.93 |
| CYL | Catalyst Metals | 6.08 | 11% | 2% | 98% | 611% | 136% | $ 1,431,667,350.08 |
| CHN | Chalice Mining Ltd | 1.13 | 4% | 25% | -28% | -14% | 2% | $ 429,874,600.74 |
| KAL | Kalgoorliegoldmining | 0.043 | 0% | -33% | 115% | 65% | 139% | $ 17,165,797.97 |
| MLS | Metals Australia | 0.0195 | -3% | 3% | -30% | -7% | -15% | $ 13,845,670.96 |
| ADN | Andromeda Metals Ltd | 0.017 | -32% | 143% | 183% | -6% | 143% | $ 58,288,370.71 |
| MEI | Meteoric Resources | 0.099 | 0% | 41% | -6% | -55% | 16% | $ 222,001,964.29 |
| SRN | Surefire Rescs NL | 0.003 | 0% | 0% | -25% | -73% | -14% | $ 7,248,923.44 |
| WA8 | Warriedarresourltd | 0.105 | 25% | 81% | 110% | 69% | 139% | $ 105,257,020.99 |
| HMX | Hammer Metals Ltd | 0.036 | 24% | 50% | -5% | -8% | 9% | $ 31,071,554.50 |
| WCN | White Cliff Min Ltd | 0.034 | 70% | 127% | 89% | 113% | 113% | $ 57,429,622.44 |
| AVM | Advance Metals Ltd | 0.044 | -21% | 22% | 13% | 91% | 29% | $ 9,845,602.36 |
| ASR | Asra Minerals Ltd | 0.0025 | 25% | -17% | -29% | -64% | -17% | $ 5,412,093.66 |
| ARI | Arika Resources | 0.028 | 4% | 56% | 27% | 40% | 4% | $ 20,272,276.42 |
| CTO | Citigold Corp Ltd | 0.004 | 0% | 0% | 0% | -43% | 0% | $ 12,000,000.00 |
| SMI | Santana Minerals Ltd | 0.575 | 11% | 21% | -11% | 55% | 19% | $ 415,563,238.13 |
| M2R | Miramar | 0.003 | 0% | 0% | -50% | -65% | 0% | $ 2,990,469.86 |
| MHC | Manhattan Corp Ltd | 0.017 | 6% | 0% | -58% | -49% | -11% | $ 3,993,281.27 |
| GRL | Godolphin Resources | 0.01 | 11% | 11% | -41% | -58% | -31% | $ 4,488,733.12 |
| SVG | Savannah Goldfields | 0.026 | 4% | 86% | 41% | 6% | 41% | $ 20,873,048.93 |
| EMC | Everest Metals Corp | 0.15 | 15% | 0% | 15% | 67% | 11% | $ 33,619,688.25 |
| GUL | Gullewa Limited | 0.082 | -11% | 55% | 17% | 49% | 46% | $ 18,095,840.28 |
| CY5 | Cygnus Metals Ltd | 0.084 | 4% | -1% | -40% | 2% | -16% | $ 72,210,192.04 |
| G50 | G50Corp Ltd | 0.1 | -9% | -5% | -33% | -44% | -35% | $ 16,059,765.90 |
| ADV | Ardiden Ltd | 0.145 | 4% | 4% | 7% | -9% | 7% | $ 9,065,038.37 |
| AAR | Astral Resources NL | 0.16 | 3% | 10% | 14% | 135% | 19% | $ 226,788,498.88 |
| VMC | Venus Metals Cor Ltd | 0.11 | 10% | 16% | 51% | 20% | 64% | $ 21,574,155.13 |
| NAE | New Age Exploration | 0.004 | 0% | 0% | -20% | 0% | 14% | $ 11,967,295.10 |
| VKA | Viking Mines Ltd | 0.007 | 0% | 0% | -42% | -42% | -13% | $ 10,751,589.99 |
| LCL | LCL Resources Ltd | 0.007 | 0% | 17% | -22% | -36% | -30% | $ 8,363,688.95 |
| MTH | Mithril Silver Gold | 0.375 | 9% | 17% | -6% | 88% | -6% | $ 53,932,503.14 |
| ADG | Adelong Gold Limited | 0.007 | 17% | 40% | 75% | 75% | 56% | $ 8,384,917.19 |
| RMX | Red Mount Min Ltd | 0.008 | 0% | 14% | -20% | -20% | -11% | $ 3,254,704.57 |
| PRS | Prospech Limited | 0.027 | -4% | 13% | -4% | -40% | -7% | $ 8,878,298.95 |
| TTM | Titan Minerals | 0.4 | 0% | 3% | -18% | 54% | 5% | $ 106,889,339.46 |
| AKA | Aureka Limited | 0.13 | -4% | -7% | -99% | -99% | -4% | $ 11,267,838.56 |
| AAM | Aumegametals | 0.036 | 0% | -13% | -28% | -50% | -14% | $ 22,352,182.55 |
| KZR | Kalamazoo Resources | 0.089 | 10% | 16% | 2% | -2% | 20% | $ 19,745,416.53 |
| BCN | Beacon Minerals | 0.028 | 4% | 12% | 27% | -3% | 27% | $ 118,339,072.38 |
| MAU | Magnetic Resources | 1.46 | 1% | 9% | 25% | 33% | 32% | $ 406,924,874.08 |
| BC8 | Black Cat Syndicate | 0.96 | 2% | 6% | 79% | 243% | 70% | $ 686,304,790.21 |
| EM2 | Eagle Mountain | 0.005 | 0% | 0% | -87% | -92% | -44% | $ 5,675,186.45 |
| EMR | Emerald Res NL | 4.58 | 13% | 19% | 19% | 31% | 41% | $ 3,043,842,645.34 |
| BYH | Bryah Resources Ltd | 0.005 | 25% | 25% | 25% | -33% | 67% | $ 4,349,767.61 |
| HCH | Hot Chili Ltd | 0.47 | 2% | 3% | -43% | -58% | -33% | $ 75,798,074.50 |
| WAF | West African Res Ltd | 2.51 | 9% | 14% | 51% | 73% | 75% | $ 2,860,913,692.52 |
| MEU | Marmota Limited | 0.041 | -2% | 14% | 14% | -5% | 5% | $ 48,310,537.39 |
| NVA | Nova Minerals Ltd | 0.325 | -2% | 41% | 59% | 35% | -12% | $ 106,589,147.61 |
| SVL | Silver Mines Limited | 0.097 | -3% | 10% | -3% | -45% | 24% | $ 177,977,539.20 |
| PGD | Peregrine Gold | 0.15 | 2% | -19% | -6% | -32% | 7% | $ 12,727,161.15 |
| ICL | Iceni Gold | 0.054 | -8% | -23% | 8% | -39% | -24% | $ 17,915,357.78 |
| FG1 | Flynngold | 0.025 | 14% | 14% | -17% | -11% | 0% | $ 9,782,911.75 |
| WWI | West Wits Mining Ltd | 0.019 | 0% | 19% | 36% | 36% | 36% | $ 52,502,334.46 |
| RML | Resolution Minerals | 0.0095 | 19% | 36% | -41% | -41% | -21% | $ 5,257,868.55 |
| AAJ | Aruma Resources Ltd | 0.01 | 11% | 11% | -38% | -33% | -17% | $ 2,498,154.43 |
| HWK | Hawk Resources. | 0.018 | -5% | -10% | -40% | -60% | -18% | $ 4,876,730.08 |
| GMN | Gold Mountain Ltd | 0.002 | 0% | 0% | 0% | -50% | -33% | $ 9,591,959.88 |
| MEG | Megado Minerals Ltd | 0.011 | 10% | -15% | -18% | 5% | -35% | $ 4,616,515.88 |
| HMG | Hamelingoldlimited | 0.099 | 10% | 41% | 10% | 30% | 55% | $ 19,490,625.00 |
| BM8 | Battery Age Minerals | 0.053 | -12% | -12% | -46% | -47% | -50% | $ 6,313,934.89 |
| TBR | Tribune Res Ltd | 5.12 | -1% | 10% | 6% | 22% | 19% | $ 268,636,554.24 |
| FML | Focus Minerals Ltd | 0.24 | 0% | 9% | 30% | 100% | 41% | $ 63,042,901.90 |
| VRC | Volt Resources Ltd | 0.005 | 11% | 11% | 25% | 0% | 67% | $ 23,423,889.92 |
| ARV | Artemis Resources | 0.007 | 0% | -13% | -50% | -56% | -13% | $ 17,699,705.16 |
| HRN | Horizon Gold Ltd | 0.55 | 21% | 25% | 25% | 83% | 15% | $ 70,971,562.27 |
| CLA | Celsius Resource Ltd | 0.008 | 14% | 14% | -20% | -20% | -27% | $ 20,352,998.40 |
| QML | Qmines Limited | 0.039 | -7% | -9% | -38% | -43% | -28% | $ 16,512,761.11 |
| RDN | Raiden Resources Ltd | 0.005 | 0% | 25% | -84% | -89% | -55% | $ 17,254,457.21 |
| TCG | Turaco Gold Limited | 0.45 | 5% | 18% | 45% | 109% | 76% | $ 406,071,657.45 |
| KCC | Kincora Copper | 0.031 | -6% | 19% | -14% | -11% | 15% | $ 7,815,689.21 |
| GBZ | GBM Rsources Ltd | 0.009 | 13% | 29% | 13% | -10% | 13% | $ 10,539,629.80 |
| DTM | Dart Mining NL | 0.003 | -40% | -33% | -70% | -88% | -67% | $ 3,438,819.57 |
| MKR | Manuka Resources. | 0.035 | -8% | 30% | -8% | -49% | 25% | $ 28,376,868.42 |
| AUC | Ausgold Limited | 0.645 | 22% | 29% | 29% | 139% | 54% | $ 226,662,065.73 |
| ANX | Anax Metals Ltd | 0.007 | 27% | 0% | -30% | -83% | -42% | $ 7,062,460.54 |
| EMU | EMU NL | 0.025 | 19% | 4% | -7% | -6% | -7% | $ 4,065,629.59 |
| SFM | Santa Fe Minerals | 0.037 | 0% | -3% | 23% | -18% | 19% | $ 2,694,295.19 |
| PNR | Pantoro Gold Limited | 3.26 | 16% | 39% | 74% | 126% | 113% | $ 1,288,439,329.45 |
| CMM | Capricorn Metals | 9.72 | 7% | 14% | 56% | 103% | 55% | $ 4,192,739,422.83 |
| X64 | Ten Sixty Four Ltd | 0 | -100% | -100% | -100% | -100% | -100% | $ 129,844,903.32 |
| VRL | Verity Resources | 0.022 | 29% | 69% | -25% | -62% | 13% | $ 5,932,822.87 |
| HAW | Hawthorn Resources | 0.054 | 15% | 29% | -8% | -23% | 32% | $ 20,435,952.39 |
| BGD | Bartongoldholdings | 0.555 | 18% | 50% | 95% | 82% | 127% | $ 123,692,442.51 |
| SVY | Stavely Minerals Ltd | 0.011 | -15% | -35% | -62% | -59% | -35% | $ 6,528,505.12 |
| AGC | AGC Ltd | 0.145 | 0% | 0% | -31% | 56% | -6% | $ 39,772,569.41 |
| RGL | Riversgold | 0.0045 | 13% | 13% | 50% | -25% | 13% | $ 8,418,562.97 |
| TSO | Tesoro Gold Ltd | 0.027 | -4% | 0% | 13% | -37% | 35% | $ 52,427,723.58 |
| GUE | Global Uranium | 0.06 | -5% | 13% | -14% | -43% | 0% | $ 28,308,775.82 |
| CPM | Coopermetalslimited | 0.042 | 5% | 14% | -14% | -63% | -9% | $ 3,290,937.30 |
| MM8 | Medallion Metals. | 0.25 | 11% | 4% | 221% | 363% | 108% | $ 122,083,970.85 |
| FFM | Firefly Metals Ltd | 0.905 | 17% | 23% | -26% | 7% | -2% | $ 499,767,392.73 |
| CBY | Canterbury Resources | 0.018 | -14% | -28% | -28% | -74% | -18% | $ 4,048,817.92 |
| SLA | Solara Minerals | 0.115 | -12% | 10% | -52% | -63% | 28% | $ 6,378,330.53 |
| SFR | Sandfire Resources | 10.25 | 4% | 17% | -3% | 5% | 10% | $ 4,746,803,032.40 |
| TAM | Tanami Gold NL | 0.036 | 3% | 24% | 22% | -3% | 20% | $ 43,478,590.70 |
| NWM | Norwest Minerals | 0.013 | 8% | 69% | -11% | -61% | 8% | $ 6,306,553.63 |
| ALK | Alkane Resources Ltd | 0.79 | 1% | 22% | 53% | 34% | 55% | $ 490,488,932.52 |
| BMO | Bastion Minerals | 0.003 | 0% | 0% | -50% | -67% | -25% | $ 2,710,882.69 |
| IDA | Indiana Resources | 0.08 | 4% | 8% | 40% | 82% | 31% | $ 50,133,131.72 |
| GSM | Golden State Mining | 0.007 | 0% | -13% | -22% | -36% | -13% | $ 1,955,594.41 |
| NSM | Northstaw | 0.043 | 2% | 16% | 207% | 39% | 169% | $ 11,768,089.50 |
| GSN | Great Southern | 0.022 | 10% | 10% | 47% | 16% | 47% | $ 22,926,498.67 |
| VAU | Vault Minerals Ltd | 0.47 | 9% | 12% | 32% | 4% | 42% | $ 3,299,199,590.27 |
| DEG | De Grey Mining | 2.46 | 0% | 13% | 71% | 102% | 39% | $ 5,915,063,112.00 |
| THR | Thor Energy PLC | 0.011 | -8% | 10% | -27% | -35% | -15% | $ 7,818,688.19 |
| CDR | Codrus Minerals Ltd | 0.032 | 39% | 100% | 60% | -26% | 88% | $ 5,292,400.13 |
| MDI | Middle Island Res | 0.018 | 0% | 20% | 6% | 6% | 50% | $ 5,786,248.34 |
| WTM | Waratah Minerals Ltd | 0.305 | 56% | 107% | 17% | 165% | 97% | $ 61,931,520.63 |
| POL | Polymetals Resources | 0.86 | 1% | 13% | 6% | 207% | 8% | $ 224,157,309.30 |
| RDS | Redstone Resources | 0.005 | -17% | 67% | 67% | 67% | 100% | $ 5,552,270.76 |
| NAG | Nagambie Resources | 0.022 | 16% | 38% | 47% | 83% | 22% | $ 16,869,349.22 |
| BGL | Bellevue Gold Ltd | 0.975 | 11% | -15% | -32% | -44% | -13% | $ 1,432,036,323.79 |
| GBR | Greatbould Resources | 0.069 | -1% | -10% | 64% | 10% | 60% | $ 53,983,317.04 |
| KAI | Kairos Minerals Ltd | 0.02 | 0% | 0% | 25% | 67% | 67% | $ 55,249,155.97 |
| KAU | Kaiser Reef | 0.18 | 6% | 20% | 6% | 44% | 13% | $ 60,266,192.00 |
| HRZ | Horizon | 0.058 | 5% | 5% | 32% | 45% | 45% | $ 124,136,586.14 |
| CDT | Castle Minerals | 0.071 | 27% | -21% | -21% | -53% | 18% | $ 6,960,574.20 |
| RSG | Resolute Mining | 0.6 | 20% | 46% | -10% | 38% | 52% | $ 1,288,075,257.87 |
| MXR | Maximus Resources | 0 | -100% | -100% | -100% | -100% | -100% | $ 33,424,752.21 |
| EVN | Evolution Mining Ltd | 8.63 | 12% | 28% | 77% | 127% | 79% | $ 17,300,550,378.24 |
| CXU | Cauldron Energy Ltd | 0.008 | -11% | 0% | -47% | -79% | -33% | $ 13,152,641.48 |
| DLI | Delta Lithium | 0.21 | 20% | 40% | -14% | -35% | 24% | $ 154,056,485.28 |
| ALY | Alchemy Resource Ltd | 0.006 | 0% | 0% | 0% | -14% | -14% | $ 7,068,457.54 |
| NH3 | Nh3Cleanenergyltd | 0.027 | 0% | 35% | 17% | 29% | 50% | $ 14,115,119.63 |
| OBM | Ora Banda Mining Ltd | 1.105 | 8% | 10% | 31% | 245% | 70% | $ 2,203,561,188.27 |
| AVW | Avira Resources Ltd | 0.007 | 0% | -13% | -65% | -77% | -65% | $ 1,281,789.10 |
| LCY | Legacy Iron Ore | 0.008 | -20% | -11% | -36% | -45% | -20% | $ 78,096,340.67 |
| PDI | Predictive Disc Ltd | 0.365 | 0% | 6% | 38% | 78% | 59% | $ 995,729,470.18 |
| MAT | Matsa Resources | 0.067 | 12% | 22% | 43% | 123% | 91% | $ 47,642,679.37 |
| ZAG | Zuleika Gold Ltd | 0.012 | 0% | 20% | -29% | -37% | -8% | $ 9,644,439.05 |
| GML | Gateway Mining | 0.029 | -3% | 12% | 12% | 93% | 38% | $ 11,855,788.56 |
| SBM | St Barbara Limited | 0.32 | 7% | 52% | -3% | 28% | 42% | $ 346,510,829.12 |
| SBR | Sabre Resources | 0.008 | 14% | 33% | -27% | -56% | -20% | $ 3,155,695.46 |
| STK | Strickland Metals | 0.105 | 18% | 28% | 28% | 5% | 24% | $ 221,711,260.11 |
| CEL | Challenger Gold Ltd | 0.083 | 4% | 51% | 51% | 17% | 77% | $ 136,931,244.31 |
| GG8 | Gorilla Gold Mines | 0.515 | 16% | 29% | 124% | 1365% | 98% | $ 341,727,714.85 |
| NST | Northern Star | 19.77 | 4% | 1% | 18% | 35% | 28% | $ 28,451,592,142.74 |
| OZM | Ozaurum Resources | 0.082 | -11% | -17% | 128% | 39% | 173% | $ 18,549,151.71 |
| TG1 | Techgen Metals Ltd | 0.0245 | 29% | -2% | -13% | -23% | -30% | $ 3,173,314.20 |
| XAM | Xanadu Mines Ltd | 0.047 | -18% | -19% | -13% | -30% | -4% | $ 97,522,075.36 |
| AQI | Alicanto Min Ltd | 0.03 | 0% | 7% | -6% | 36% | -19% | $ 25,444,289.28 |
| KTA | Krakatoa Resources | 0.01 | 0% | 11% | -9% | -44% | 5% | $ 6,201,340.25 |
| ARN | Aldoro Resources | 0.365 | 4% | 9% | 324% | 462% | -4% | $ 68,496,191.23 |
| WGX | Westgold Resources. | 2.91 | 5% | 6% | 0% | 32% | 3% | $ 2,772,742,488.60 |
| MBK | Metal Bank Ltd | 0.011 | -8% | -21% | -50% | -44% | -27% | $ 5,472,048.98 |
| A8G | Australasian Metals | 0.07 | 0% | 8% | -10% | -13% | -11% | $ 3,994,391.03 |
| TAR | Taruga Minerals | 0.009 | -10% | 13% | -31% | 13% | -10% | $ 7,060,267.85 |
| DTR | Dateline Resources | 0.036 | 300% | 620% | 800% | 260% | 929% | $ 110,622,744.80 |
| GOR | Gold Road Res Ltd | 3.28 | 8% | 7% | 80% | 109% | 60% | $ 3,585,116,898.00 |
| S2R | S2 Resources | 0.094 | -4% | -3% | 29% | -22% | 40% | $ 43,927,225.32 |
| NES | Nelson Resources. | 0.003 | 0% | 0% | 50% | 0% | 0% | $ 6,515,782.98 |
| TLM | Talisman Mining | 0.175 | 3% | 17% | -26% | -41% | -15% | $ 32,014,459.33 |
| BEZ | Besragoldinc | 0.045 | -2% | 13% | -42% | -51% | -50% | $ 17,450,535.94 |
| PRU | Perseus Mining Ltd | 3.61 | 7% | 13% | 39% | 55% | 40% | $ 4,956,455,807.49 |
| SPQ | Superior Resources | 0.0045 | 0% | -18% | -36% | -55% | -25% | $ 9,483,930.90 |
| PUR | Pursuit Minerals | 0.037 | -14% | -18% | -75% | -84% | -61% | $ 3,989,358.52 |
| RMS | Ramelius Resources | 2.87 | 8% | 21% | 33% | 42% | 39% | $ 3,337,759,895.04 |
| PKO | Peako Limited | 0.0025 | -17% | -17% | -17% | -35% | -17% | $ 3,719,354.90 |
| ICG | Inca Minerals Ltd | 0.005 | 0% | 0% | -17% | -17% | 0% | $ 8,573,313.84 |
| A1G | African Gold Ltd. | 0.135 | 0% | 29% | 78% | 419% | 145% | $ 64,802,676.51 |
| NMG | New Murchison Gold | 0.015 | -6% | 0% | 50% | 200% | 67% | $ 157,613,601.71 |
| GNM | Great Northern | 0.016 | 14% | 23% | 23% | 45% | 14% | $ 2,164,807.08 |
| KRM | Kingsrose Mining Ltd | 0.033 | 0% | 3% | -11% | -6% | -6% | $ 24,112,848.61 |
| BTR | Brightstar Resources | 0.6 | 30% | 20% | -2% | 33% | 20% | $ 295,360,920.00 |
| RRL | Regis Resources | 4.85 | 11% | 15% | 91% | 129% | 90% | $ 3,671,621,787.24 |
| M24 | Mamba Exploration | 0.012 | 0% | 9% | 0% | -45% | 0% | $ 3,541,987.32 |
| TRM | Truscott Mining Corp | 0.06 | 0% | -8% | -23% | -4% | -23% | $ 11,486,913.60 |
| TNC | True North Copper | 0.185 | -3% | -16% | -94% | -97% | -94% | $ 18,875,852.40 |
| MOM | Moab Minerals Ltd | 0.0015 | 0% | -25% | -63% | -70% | -25% | $ 2,600,499.05 |
| KNB | Koonenberrygold | 0.085 | 20% | 89% | 507% | 431% | 608% | $ 74,367,372.38 |
| AWJ | Auric Mining | 0.23 | 2% | -12% | -27% | 39% | -32% | $ 34,259,275.33 |
| ENR | Encounter Resources | 0.19 | 3% | -3% | -46% | -47% | -42% | $ 94,770,540.61 |
| SNG | Siren Gold | 0.056 | 4% | 17% | -25% | -21% | -14% | $ 12,043,383.50 |
| STN | Saturn Metals | 0.275 | -5% | 25% | 8% | 15% | 34% | $ 122,522,838.65 |
| USL | Unico Silver Limited | 0.215 | 0% | 8% | -16% | 34% | 10% | $ 100,727,063.65 |
| PNM | Pacific Nickel Mines | 0.024 | 0% | 0% | 0% | -4% | 0% | $ 10,103,834.52 |
| AYM | Australia United Min | 0.003 | 50% | 50% | 0% | 0% | -25% | $ 3,685,154.97 |
| ANL | Amani Gold Ltd | 0 | -100% | -100% | -100% | -100% | -100% | $ 21,449,587.12 |
| HAV | Havilah Resources | 0.17 | -3% | 0% | -17% | -15% | -24% | $ 59,369,851.80 |
| SPR | Spartan Resources | 2.22 | 7% | 19% | 69% | 283% | 57% | $ 2,857,891,250.09 |
| PNT | Panthermetalsltd | 0.015 | -6% | 0% | -32% | -45% | 36% | $ 4,212,663.67 |
| MEK | Meeka Metals Limited | 0.145 | 0% | 4% | 123% | 292% | 88% | $ 377,215,150.50 |
| GMD | Genesis Minerals | 4.36 | 13% | 21% | 95% | 143% | 77% | $ 4,914,163,375.50 |
| PGO | Pacgold | 0.08 | 0% | 21% | -11% | -45% | 7% | $ 10,516,347.04 |
| FEG | Far East Gold | 0.155 | 3% | 29% | -16% | 11% | -14% | $ 56,889,255.22 |
| MI6 | Minerals260Limited | 0.135 | 13% | 4% | 4% | -7% | 4% | $ 279,089,999.96 |
| IGO | IGO Limited | 4.15 | 7% | 26% | -22% | -47% | -13% | $ 3,082,079,998.91 |
| GAL | Galileo Mining Ltd | 0.115 | 5% | -12% | -15% | -56% | -8% | $ 22,726,866.61 |
| RXL | Rox Resources | 0.315 | -13% | -10% | 85% | 91% | 58% | $ 210,401,543.72 |
| PTN | Patronus Resources | 0.058 | -9% | -2% | -12% | -3% | 18% | $ 99,881,266.04 |
| CLZ | Classic Min Ltd | 0.001 | 0% | 0% | 0% | -88% | 0% | $ 1,544,025.56 |
| TGM | Theta Gold Mines Ltd | 0.135 | -4% | 0% | -27% | -13% | -25% | $ 118,722,864.51 |
| FAL | Falconmetalsltd | 0.115 | 5% | 20% | -26% | -21% | 0% | $ 21,240,000.00 |
| SPD | Southernpalladium | 0.23 | 7% | -31% | -67% | -54% | -62% | $ 22,282,750.00 |
| ORN | Orion Minerals Ltd | 0.012 | -8% | -8% | -29% | -33% | -20% | $ 75,354,926.00 |
| TMB | Tambourahmetals | 0.025 | -4% | -11% | -19% | -63% | 19% | $ 2,822,161.10 |
| TMS | Tennant Minerals Ltd | 0.007 | 0% | -33% | -46% | -67% | -22% | $ 8,603,013.74 |
| AZY | Antipa Minerals Ltd | 0.485 | 1% | 24% | 120% | 341% | 87% | $ 278,593,952.69 |
| PXX | Polarx Limited | 0.008 | 0% | 23% | -11% | -38% | 23% | $ 21,379,508.80 |
| TRE | Toubani Res Ltd | 0.27 | -7% | 42% | -4% | 145% | 59% | $ 73,331,911.61 |
| AUN | Aurumin | 0.075 | 23% | 32% | 17% | 92% | 14% | $ 37,069,510.80 |
| GPR | Geopacific Resources | 0.021 | 0% | 11% | -25% | -6% | 5% | $ 63,649,306.52 |
| FXG | Felix Gold Limited | 0.16 | -6% | 3% | 100% | 105% | 90% | $ 52,625,021.76 |
| ILT | Iltani Resources Lim | 0.25 | -4% | 25% | 47% | 32% | 22% | $ 11,313,749.73 |
| BRX | Belararoxlimited | 0.08 | -11% | -56% | -64% | -68% | -54% | $ 12,521,788.32 |
| TM1 | Terra Metals Limited | 0.027 | 4% | -4% | -31% | -54% | -4% | $ 11,006,146.67 |
| TOR | Torque Met | 0.099 | 4% | 32% | 48% | -29% | 87% | $ 25,348,409.04 |
| ARD | Argent Minerals | 0.02 | -5% | 5% | -23% | 11% | 18% | $ 30,358,450.08 |
| LM1 | Leeuwin Metals Ltd | 0.17 | 10% | 13% | 127% | 154% | 21% | $ 17,641,117.20 |
| SX2 | Southgold Consol | 5.7 | 9% | 24% | 0% | 0% | 0% | $ 793,848,491.94 |
Much like last week, Dateline Resources enjoyed outsized gains after Donald Trump called out its permitting success with the Bureau of Land Management, which confirmed its right to mine the 1.1Moz Colosseum gold mine in California.
Strangely it seems to be the as yet untested rare earths potential of the operation which really has the US President buzzing.
Once owned by Barrick, Colosseum is a historic gold producer but sits just 10km from Mountain Pass, the US' only operating rare earths mine.
Dateline announced on Monday that it was preparing to conduct drilling for rare earths are the project where a gold feasibility study is also ongoing.
White Cliff Minerals (ASX:WCN)
A thick intercept of good grade copper has WCN's tail up, striking 175m at 2.5% Cu & 8.66g/t silver from 7.6m, including 14m at 7.55% Cu & 25.8g/t Ag from 138m at the Rae project in Canada's Nunavut province.
The hit included 3.9% Cu & 14.96g/t Ag over its last 60m and 4.46% copper at the end of the hole.
A second hole delivered 52m at 1.16% Cu & 3.43g/t Ag from surface, including 7.6m at 3% Cu & 9.5g/t Ag from 18.28m, with more assays from the first pending.
It demonstrates the potential for WCN to grow an existing non-JORC compliant resource and the copper and silver rich site.
White Cliff called the strike at Danvers "globally significant".
"DAN25008 was prioritised for assay due to the abundance of visual sulphides observed during drilling, and these results have underpinned our confidence in those visuals prevalent in the Company’s prior work," MD Troy Whittaker said.
"We believe this drill hole ranks among the most significant copper intersections globally within the last 50 years and comfortably sits within the top 10 globally reported “grade-metre” copper results.
"This discovery and outstanding results from Danvers is a clear testament to our technical team’s expertise and geological understanding, in particular the professionalism and persistence of Olga Solovieva and Sam Vaughan.
"To illustrate the magnitude of this result, the DAN25001 intercept of 52m at 1.2% Cu - a strong result in its own right - now appears modest when viewed alongside the 175m @ 2.5% Cu from DAN25008. In the context of global copper supply constraints, the Company is well positioned to leverage these results with mineralisation from surface, supporting potential open pit mining activities and an open water port less than 80km from the deposit."
At Stockhead, we tell it like it is. While White Cliff Minerals is a Stockhead advertiser, it did not sponsor this article.
Originally published as Gold Digger: As gold demand rises, here’s how you find an outperformer

The little phosphate stock with big potential
Renowned resources investor Hedley Widdup says ASX junior PhosCo’s Gasaat project in Tunisia should be housed within a global major.

Ada Ann shines for Forrestania
Forrestania Resources has been a star performer with golden results of up to 25.6g/t at Ada Ann within the Bonnie Vale project.

ASX climbs 0.48pc ahead of US-China talks
The ASX has posted a 0.48pc gain on the back of tech and banking stocks, while all attention turns to upcoming US-China trade discussions.

ASX health stocks fall but quarterlies were positive
The macro picture remains uncertain but “a little bit better” according to Morgans’ Scott Power as ASX health stocks fall 1.3% for week ending May 9, 2005.

ASX up as Trump says ‘Buy’; Bitcoin soars
The ASX wobbled but stayed green with Macquarie soaring 4%, Bitcoin smashed through $102k on Trump’s trade hype.
How is the copper market travelling?
Copper markets have grown increasingly difficult to read. We peeped the latest analysis from Benchmark to help you out.