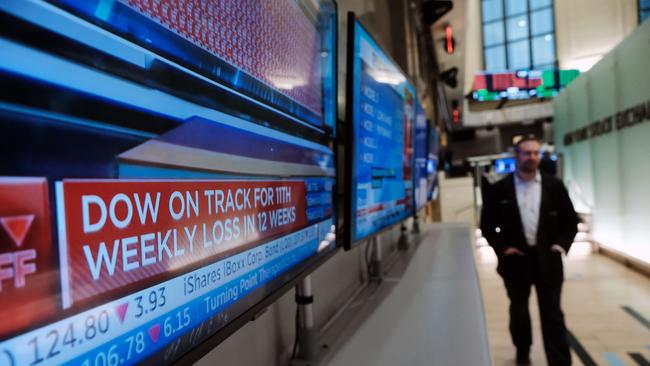
Grin and bear it: big falls mean big gains in the inevitable recovery
Bear markets don’t last. They come to an end, and when they end it is because a bull market has begun.

Recently I have explained the arithmetic of investing when quality companies have endured compressed price/earnings multiples, why I have decided to add to my small cap fund investments, that Warren Buffett’s Berkshire Hathaway has been buying, and we’ve offered some of the pithy Buffett quotes that serve to help navigate the current market gloom.
Today we offer another reason to consider becoming an optimist amid a sea of doomsayers: bear markets don’t last. They come to an end, and when they end it is because a bull market has begun.
According to CFA analyst Ben Carlson, the average S&P 500 bear market (measured from peak to trough) lasts a year and the average time to fully break even (as measured by the return to the previous peak) is a further 21 months.
Now bear in mind, Carlson’s analysis of bear markets since World War II has an insufficient number of observations for any findings to be statistically significant. Nevertheless, if we suspend that reality for a moment, history might offer some practical insights at least about the range of possible outcomes.
A further, and arguably more interesting, question to answer is: once in a bear market (a 20 per cent decline from peak), how long, on average, does it take to reach the bottom of the bear market?
The shortest bear market was the 1957 decline of 20 per cent, which took only 98 days. The market subsequently bottomed a day later and didn’t fall much further than 20 per cent. The 1973-74 market slide began in January 1973 and took 320 days to reach the bear market status of a 20 per cent decline. It then took another 310 days to ultimately achieve a 48.2 per cent decline from the January 11, 1973 peak.
According to observations, the average time taken to reach a bear market (20 per cent decline) is 236 days and the average number of days from reaching that 20 per cent decline to the absolute low is a further 131 days. Our own analysis of the current bear market is that the S&P 500 peaked on January 4, 2022, at 4818 points. The subsequent 20 per cent decline was achieved (exceeded) on May 20 when the S&P 500 reached a low of 3810 points. The 137 days it took this year for the S&P 500 to fall 20 per cent renders it the fifth fastest bear market since World War II. And thus far the market has taken another 27 days (19 trading days) to fall further, to a low of 3636, making the extent of the current bear market 24.5 per cent.
According to our own calculations, if the market takes the average time since World War II to reach its nadir, and then the average time again to recover its losses, the previous market peak will be seen again around February 4, 2024. Of course there are lies, lies and statistics. Averages are often entirely useless; I could, for example, stick my head in an oven and my feet in a freezer and my average temperature would be about right. But I would be dead. So the above analysis is next to useless as a predictor of what will happen next. What is important however is that the work offers some reassurance the present bear market will end. And that’s why investing when times are darkest makes perfect sense.
But there is an even more helpful observation the above work reveals. The market is currently around 24 per cent below its all-time highs. We are confident it will eventually recover. We also know it takes, on average, about two years for the market to recover fully from the 20 per cent bear market signpost. And finally, for a full recovery from a 24 per cent slide, the market must rally 31.5 per cent.
If it takes two years for the market to rally 31.5 per cent, the equivalent CAGR (compound average annual return) is 14.7 per cent. So that’s a return of 14.7 per cent per annum from here if some of the averages play out.
Let’s now take the worst post- World War II experience and assume the market falls another 25 per cent from the peak (2000-02), takes 576 days to bottom, and then takes 48 months to recover (2000-02). The compounded average annual return from today, if it took five-and-a-half years for the S&P 500 to regain the January 2022 highs, would be approximately 5.11 per cent.
Between the worst case scenario (since World War II) to the average case, the returns on offer from today are between 5 and 15 per cent per annum.
Finally, one of the most important investing axioms is this; the lower the price you pay, the higher your return.
If the market continues to fall from here, the subsequent returns as the market recovers to break-even will be higher. The lower the market falls, the more enthused you should become. Buffett once pointed out: “In stocks, it’s the only place where when things go on sale, people get unhappy.” You should be salivating as stocks fall.
Our job, and yours, is not to invest in indices but to find businesses with faster than average growth and better than average balance sheet quality, competitive advantages and profitability. The odds of even better returns then rise further as we whittle down the stocks that comprise the index to those that represent quality growth.
Roger Montgomery is chief investment officer and founder of Montgomery Investment Management.


To join the conversation, please log in. Don't have an account? Register
Join the conversation, you are commenting as Logout