
This is the year you will be able to afford a home
This is the exact year the average Aussie will be able to afford to buy a home, according to shocking new statistics.

ANALYSIS
In the recent federal election, the issue of housing affordability was once again a key political battleground.
Despite the Coalition and Labor having very different policy approaches on how to address the issue of housing, the underlying position of the two major parties is effectively in lock step, they do not want falling housing prices.
As any economist will tell you, attempting to limit the price growth of an asset to a very specific level over a period of decades is an extremely challenging task, particularly one like Australian housing, which has historically been defined by boom, bust cycles going back more than a century.
MORE: Up $13m: Your home worth in 5 yrs exposed
But let’s imagine for a moment it’s possible to get housing prices to magically grow slower than wages by the same amount every year for as long as it takes for incomes to catch up, how long would that take?
It’s a long road
In order to give Labor and the Coalition’s idea the best chance to succeed, we are going to tilt the scales in favour of a positive outcome by using the following settings:
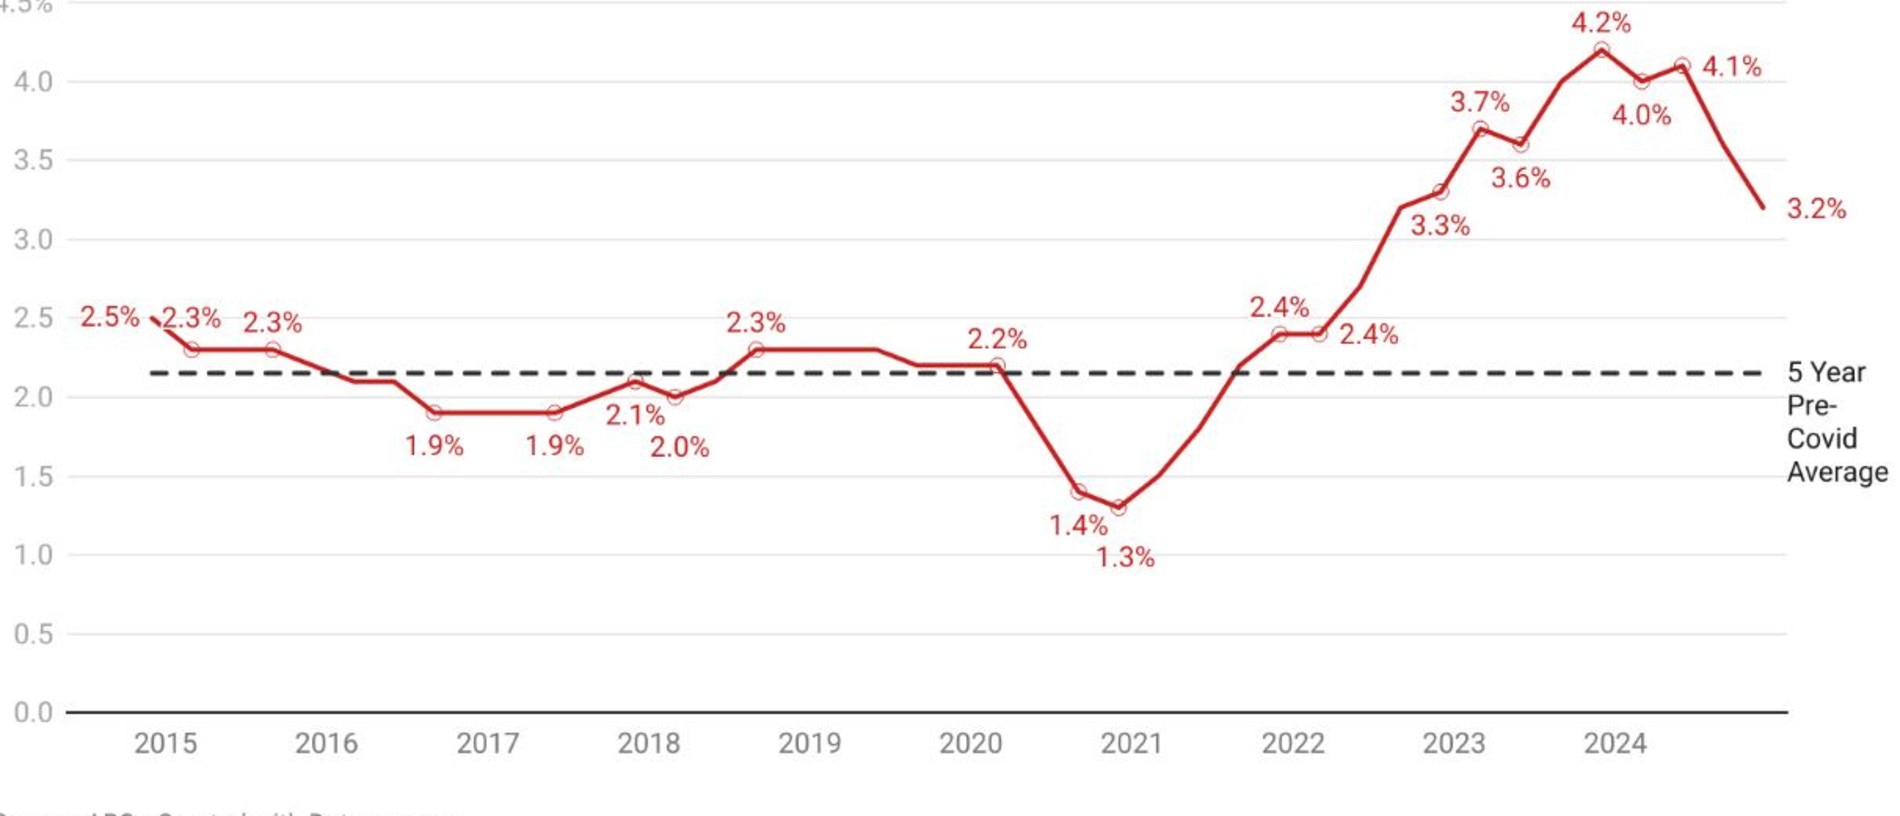
- Wages will grow at 3 per cent per year, every year for as long as it takes. This compares quite favourably to the pre-Covid 5-year average rate of wages growth of 2.15 per cent.
MORE: Home loan trap taking years to escape
- Housing prices will grow at 2 per cent per year, well below the compound average rate of 6.9 per cent seen over the last 25 years and significantly below the price growth seen during the pandemic
-The yardstick for a home to be considered affordable for a household is when mortgage repayments reach a level equivalent to 35 per cent of the median household’s total gross income. This is significantly higher than the traditional yardstick of 30 per cent of gross income
-We will assume mortgage rates are cut to a level of 4.75 per cent, which represents a cut of roughly 1.4 percentage points from where they currently stand. This is significantly lower than the average discount variable rate of 5.9 per cent provided to owner occupiers in the 15 years’ worth of pre-pandemic data on offer from the RBA on this metric.
The analysis will use the median earning household for each capital city and will assume that they have a 5 per cent deposit and cash put aside to pay for stamp duty, conveyancing plus all the other various transaction costs and that they are purchasing the median house.
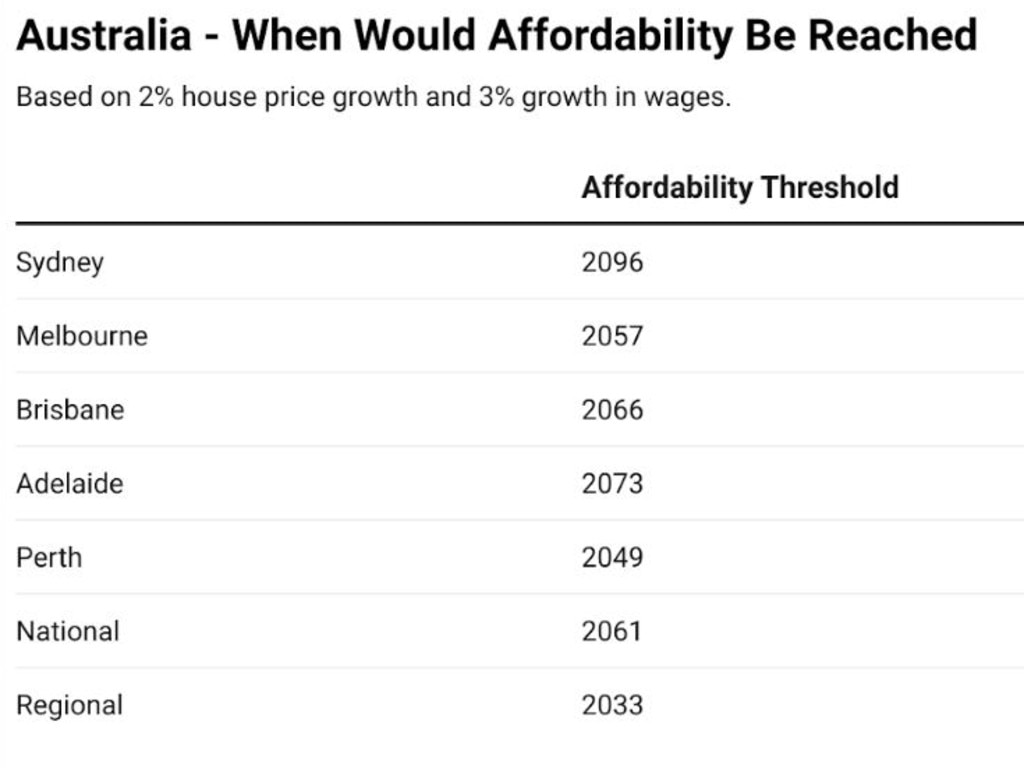
Based on these settings, the nation’s largest city of Sydney will reach our defined level of affordability in the year 2096.
Unfortunately, no, that is not an error, it would take roughly 71 years for the median household to be able to afford the median Sydney house.
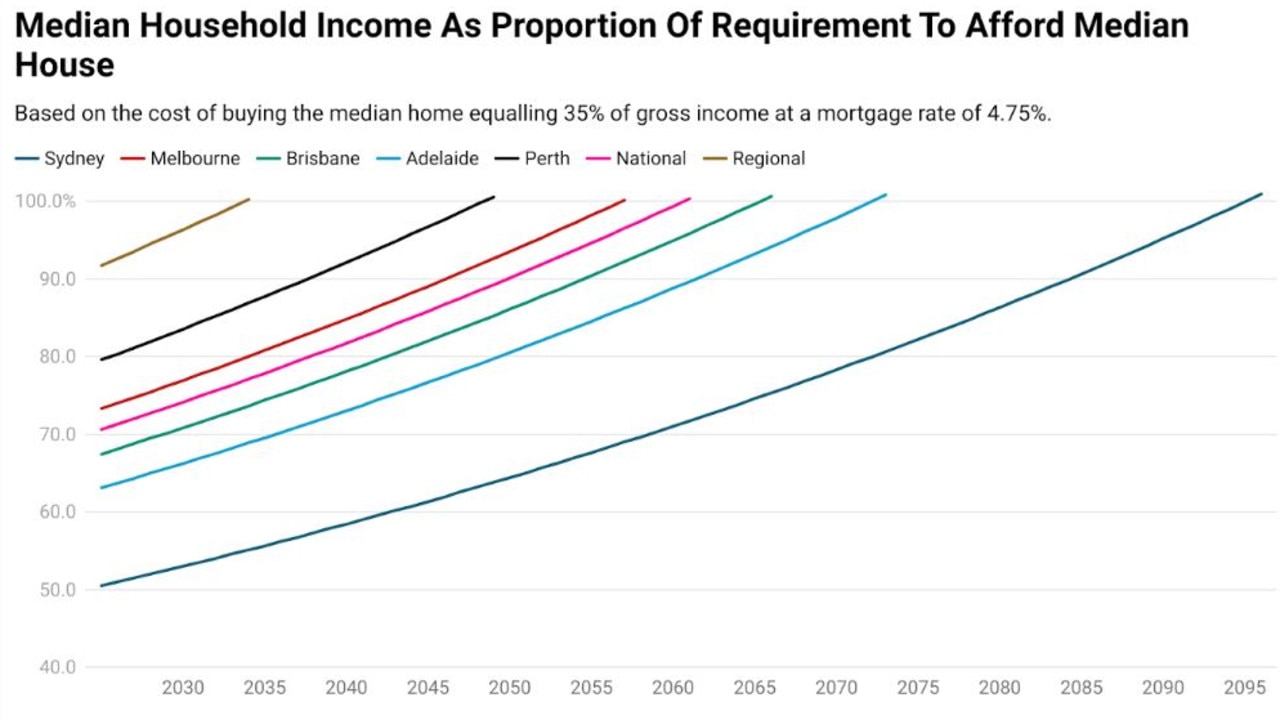
The news elsewhere in the country is better, but still not great. In terms of capital cities, Perth would be the first to return to affordability in this scenario, with that occurring in 2049, 24 years from now.
Is this realistic?
Analysis such as this is often followed by criticism that it’s unrealistic or that it’s always been this hard.
But that simply isn’t the case.
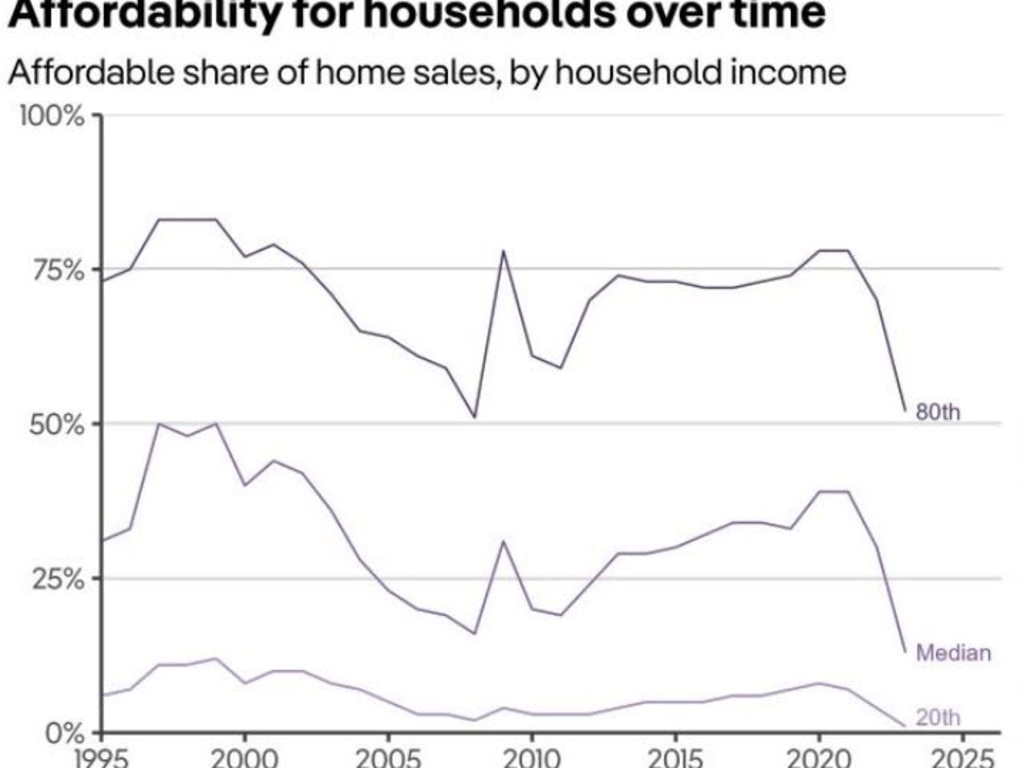
According to the PropTrack Housing Affordability Report, in 1999 the median earning household nationally could afford to buy the median home.
Before we go further, there are some notable differences between today’s analysis and PropTrack’s.
PropTrack’s yardstick for affordability is repayments equalling 25 per cent of gross household income, whereas we are using 35 per cent of gross household income. Proptrack’s numbers are for all homes, whereas today’s is for houses specifically.
However, when you account for these differences, in today’s analysis the hypothetical household has 40% more in relative terms to spend on repayments and the median house is 7.9 per cent more expensive than the median dwelling.
Overall, at a national level 1999 held a far superior level of affordability even once the differences in the two analysis methodologies are accounted for.
The takeaway
While wages growing faster than housing prices year after year, decade after decade is the most politically desirable option, from a practical perspective it’s not really viable.
Even if it was largely viable the vast majority of the time, a single year of booming housing prices is all it would take to undermine potentially a decade of progress made toward more affordable homes.
Despite the potential political downsides, the easiest way to restore broad based affordable housing across the nation is lower prices.
This is something that has already inadvertently played out across the Tasman in New Zealand.
Since their post-Covid peak, housing prices in New Zealand at a national level have fallen 17.5 per cent, 22.1 per cent in Auckland and 25.1 per cent in Wellington.

Yet despite the relatively widespread perception of this type of housing price downturn having all sorts of severe negative knock-on effects, it has largely played out with a whimper, rather than a bang.
Ultimately, lower housing prices and more affordable homes could be achieved in relatively short order if the political will existed within the major parties to do so, an effort could be made to pull the required levers to sufficiently reduce demand and increase supply of homes on the market.
But both the Coalition and Labor have made it abundantly clear that this is the polar opposite of their goals.
Join the conversation

Darwin icon going under the hammer
An architecturally-designed home in a highly sought after pocket of Larrakeyah has hit the market for the first time, having weathered Cyclone Tracy and surviving everything the Top End has thrown at it since.
Read more

Million-dollar savings: Brisbane’s bargain suburbs exposed
The shocking truth about Brisbane’s housing market is a mere 2km could save you nearly $2m, with surprising disparities on offer to buy a home without breaking the bank. SEE WHERE
Read more

Bargain homes list exposes brutal Sydney truth
Areas where home seekers can get the cheapest deals within easy reach of the CBD have been revealed - but hidden in the data is a bombshell.
Read more