
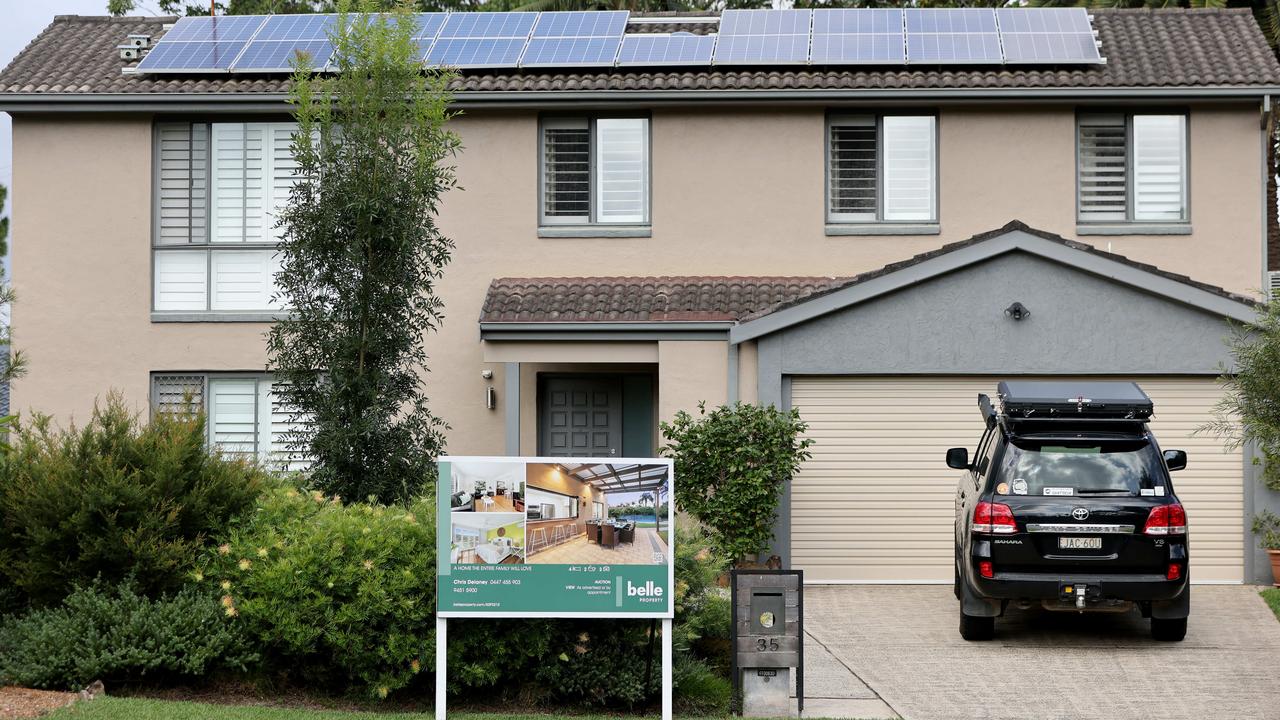
Australian housing market could crash with one move
There’s only one thing keeping house prices more buoyant than they possibly should be — but that could all be about to change.

ANALYSIS
Since the pandemic first arrived on Australia’s shores back in early 2020, the housing market has experienced quite the rollercoaster ride. At first it experienced a significant fall as uncertainty mounted over how the pandemic would impact the economy and the way we live our lives.
As 2020 headed towards its close, the course of the market changed dramatically. With demand juiced by superannuation withdrawals, the lowest interest rates in Australian history and cheap fixed rate loans facilitated by the RBA providing $188 billion in extremely cheap funding to the banks, housing prices began to recover.
By the time 2021 was a few months in, the largest and arguably most broadbased housing price boom in Australian history was underway.
But like all good roller-coasters, there was another big drop to come. By March of 2022 housing prices in Sydney and Melbourne had begun falling, albeit at a rather pedestrian pace.
When the RBA started raising interest rates in May of last year, price falls began to accelerate, with some data providers noting the largest falls in capital city home prices since at least the early 1980s.
How fast are prices falling?
At first glance this seems like a rather simple question, but it actually depends on who you ask.
According to data provider PropTrack, capital city housing prices have fallen by 5.49 per cent from their peak, with Sydney leading the way down, dropping 7.23 per cent and Darwin still at its peak.
However, other housing price data providers see things quite differently.
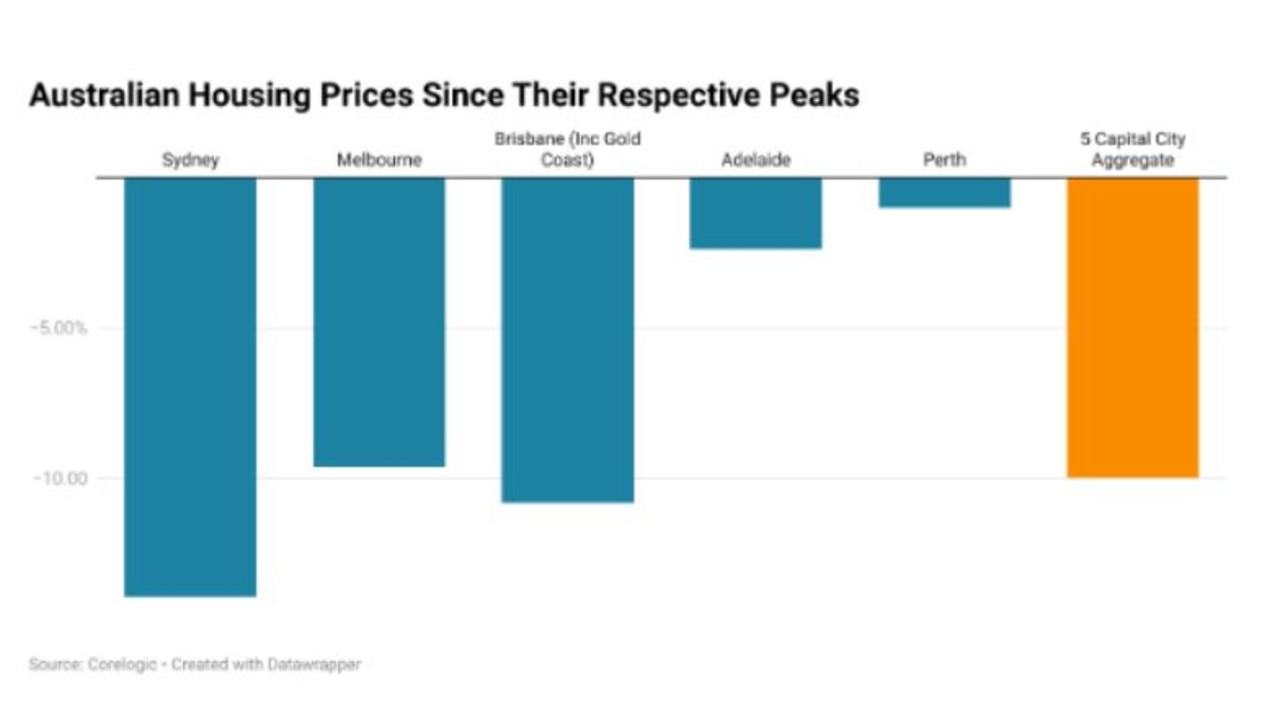
According to data from Corelogic housing prices are down across all the capital cities. At a five capital city aggregate level which covers Sydney, Melbourne, Adelaide, Brisbane and Perth, home prices are down 10 per cent from their peak. Sydney has led the nation down with prices falling 13.9 per cent, with Perth proving the most resilient down just 1.0 per cent from its peak.
How Aussie property changed…
In the various market cycles the Australian property market has experienced over the decades, conditions have been vastly different to the way they stand today or even the way they were during the boom times seen during the pandemic.
In late 2021, housing turnover as a percentage of total housing stock surged to 6.2 per cent, the highest level since the Rudd government First Home Buyer Grant boosted activity in the late 2000s.
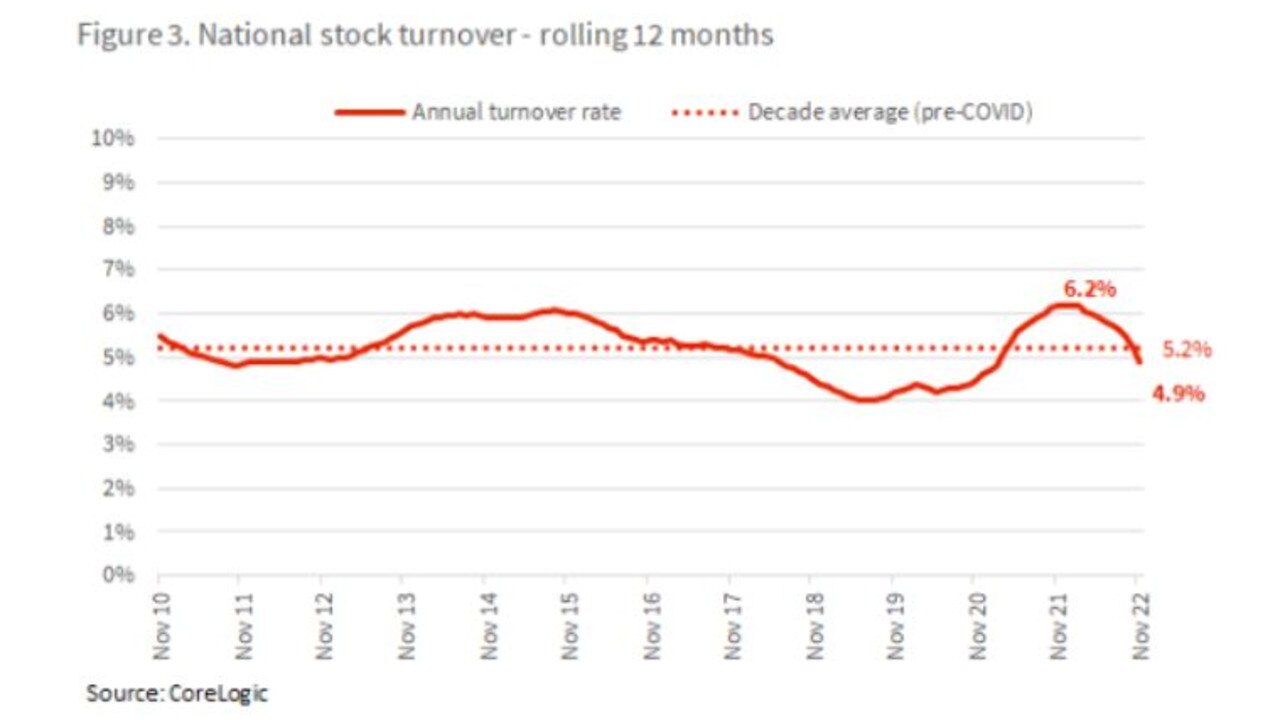
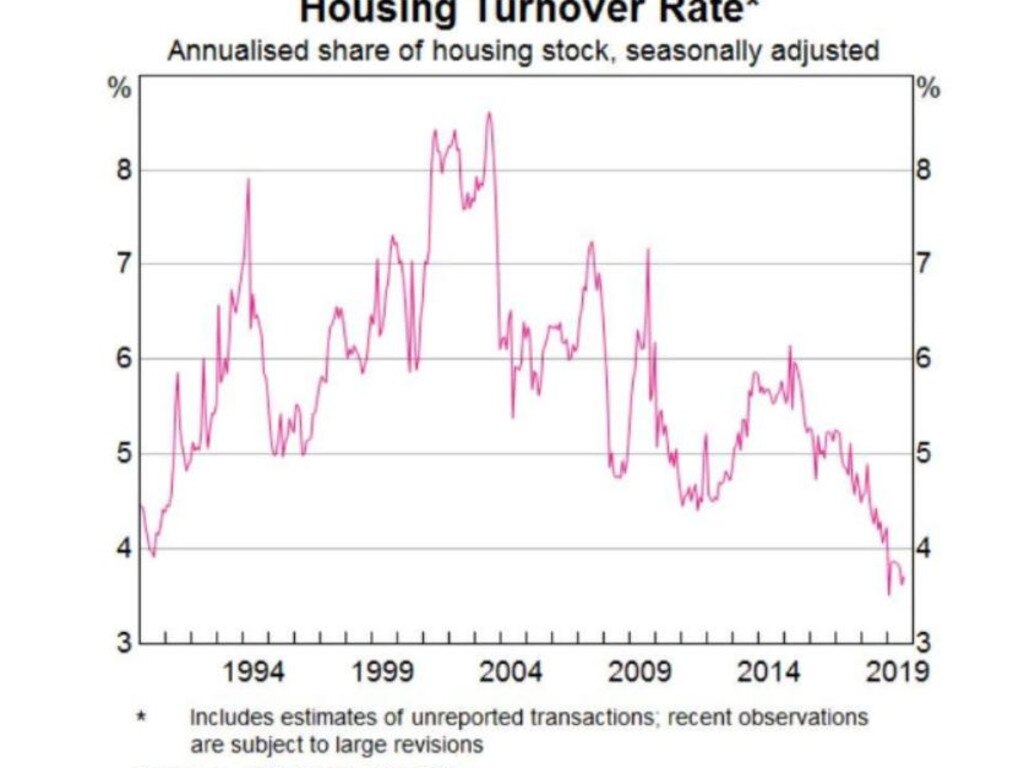
But it’s worth noting that even this highly elevated level of turnover driven by the lower interest rates in Australia history, pandemic driven demand and all manner of government interventions at a state and federal level, is still well below the high’s recorded in the early 2000s.
With interest rates now rising and pandemic driven demand fading, the market appears to be heading for a very different set of conditions, where turnover and new listings are far lower.
New listings collapse
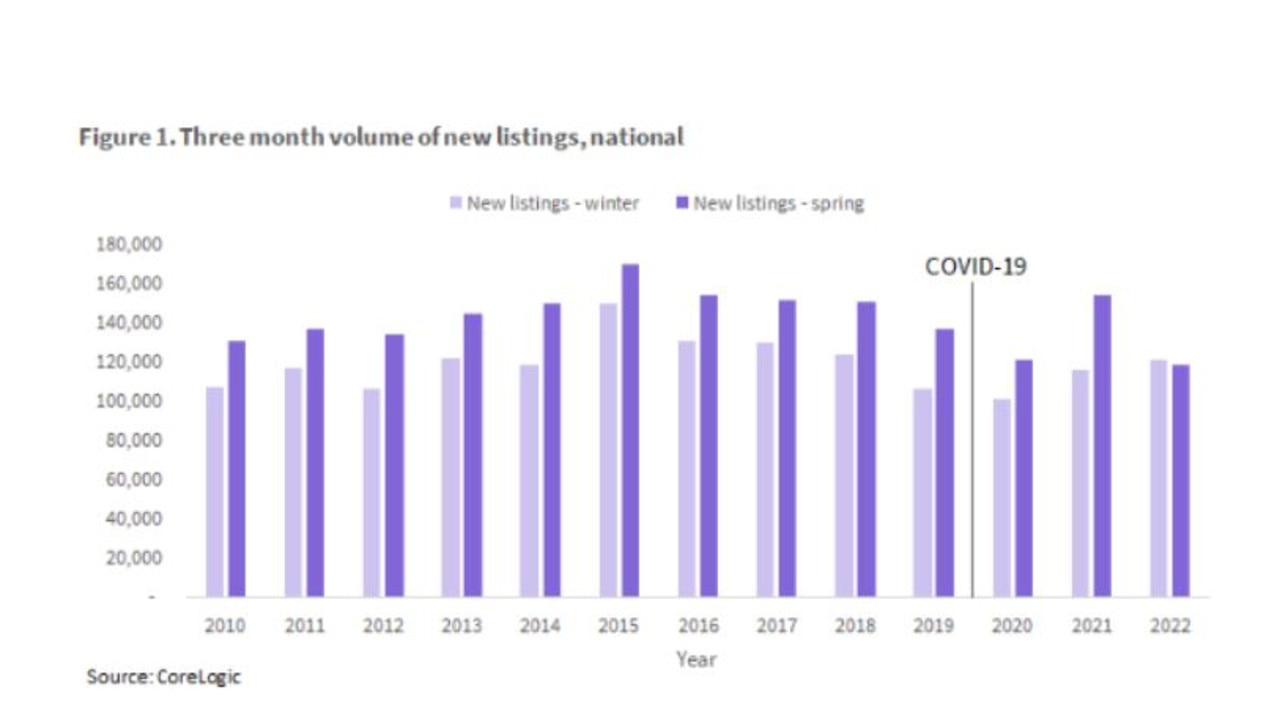
According to figures from property data provider Corelogic, the number of new listings recorded during the spring selling season of last year was at its lowest level since at least 2010. During every year for over a decade new listing volumes have always been higher in spring than in winter, but not in 2022. Instead listing volumes actually declined as more and more homeowners simply refused to put their property on the market amid falling home prices.
While it may not seem like it, low listing volumes are actually doing a great deal to support housing prices. Currently the total number of capital city homes listed for sale is 19 per cent below the five year average and down well over 40 per cent from levels seen during the last housing price downturn in 2018.
Amidst this collapse in listing volumes, the impact of the drop in demand driven by higher interest rates has been much less hard hitting than it would have been if the level of stock on the market wasn’t already depressed by Covid related factors and low levels of new listings.
Turnover falls
Amidst falling new listing volumes and lower levels of overall stock on the market, since October last year turnover within capital city housing markets has fallen below the average of the five years prior to 2021.
Considering that those years include a depressed level of transactions between 2017 and 2019 due to tighter lending standards resulting from the Banking Royal Commission, as well as the first year of the pandemic which was hard hit by lockdown, it illustrates nicely how far transaction volumes have fallen.
For now at least lower levels of demand have been at least somewhat balanced out by significantly lower listing volumes, but the big question is how long this will last.
Looking forward
With a stand off between prospective home buyers and prospective home sellers ongoing, rising rates and the conclusion of fixed rate loans driving borrowers on to more expensive variable rates could potentially change that.
According to data from the RBA, 14.6 per cent of borrowers face negative spare cash flow if the cash rate is raised one more time to 3.6 per cent. In recent days more and more analysts have raised their forecasts for the peak of the cash rate, with one analyst raising the possibility of a 4.85 per cent cash rate by August.

While it will be quite a long time before a large number of borrowers could find themselves in truly dire straits, we could see pressure begin to build on households struggling with higher rates in the coming months to reconsider their position and explore the possibility of selling their home.
On the other hand, the longer low listing volumes persist, the longer the market will be offered this strong degree of support in balancing out the sizeable drop in demand driven by higher rates.
Tarric Brooker is a freelance journalist and social commentator | @AvidCommentator

Major change as Prince George celebrates 12th birthday
Prince George turns 12 today and must follow one lonely rule as of now that will change his life forever.

Home featured on Megan Gale’s Australia’s Best House for sale
A home that featured on Australia’s Best House, hosted by supermodel Megan Gale, has been listed for sale for offers over $1.9 million. Take a look inside.

Move in next door to billionaire chicken heiress at Piper
The wife of the late Ingham chicken billionaire sold her house for nearly $30m to buy an apartment in this incredible development.