JobSeeker payment: Pandemic sparked wage loss but rise in bank deposits
We’re in recession but new figures show Aussies are 12 per cent richer than a year ago – and it’s all thanks to the government’s massive overcompensation.

ANALYSIS
There is something very weird and strange going on in the Australian economy right now. You have to check out this graph that Commonwealth Bank has made. It is a bit of a mind-bender, so bear with me while I explain it.
The most important part of this graph is the black line. It shows how much money Australians are getting in their bank accounts this year compared to last year, from both wages and welfare. At the start of the year, pre-pandemic, the line was chugging along at about 4-5 per cent. That means that if you add up all the money Aussies made in February, it was about 4 or 5 per cent more than in February 2019, due to higher population, inflation, etc.
Then the pandemic strikes. You expect the black line to fall as we make less money. And what happens? The black line goes … up!
RELATED: Economic risk of Victoria’s ‘second wave’

When the pandemic strikes, wages fall (the blue bars) but government benefits go up (the red bars). What is so surprising here is that the rise in government benefits is so large that the total income of Australians (the black line) actually goes up – not down. We are, according to this proprietary data from Commonwealth Bank accounts, suddenly getting up to 12 per cent more money than last year.
The result is this: We are in a recession where Australians are pocketing more money not less. That is crazy! A recession where Australians make more money? It isn’t supposed to be like that.
Recessions are, by definition, times of falling national income, falling GDP. But Centrelink payments don’t count to GDP. So we can have falling GDP (it is expected to fall a bit over 4 per cent in the three months from March to June) but rising Australian incomes.
The big payments affecting the red bars are:
•The two $750 payments that went to pensioners and other welfare recipients early in the pandemic.
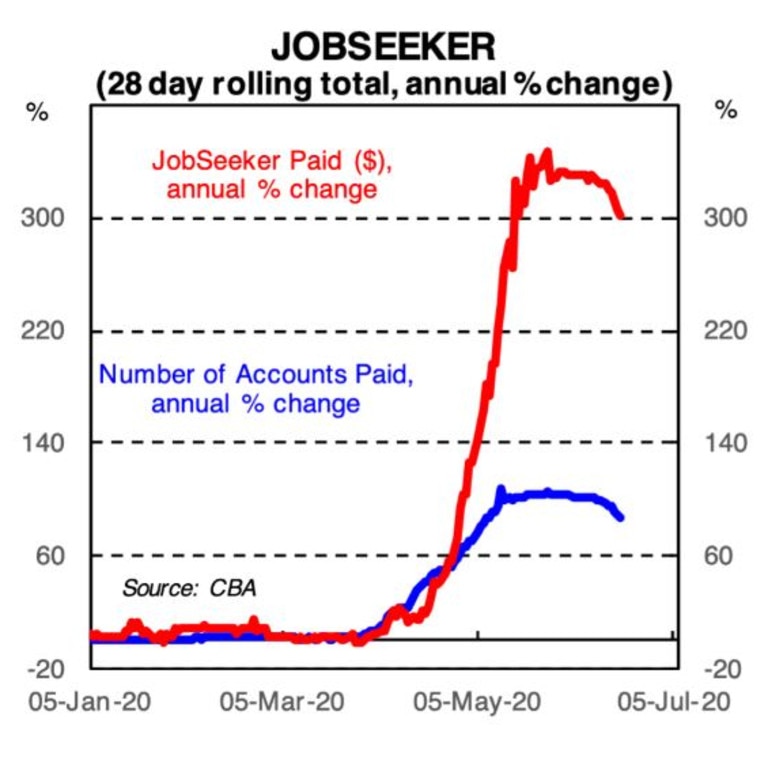
•The massive increase in the payment that used to be called the dole: JobSeeker. There were almost 1.5 million people getting JobSeeker in May, double the numbers in January, and it is $550 higher than it used to be.
RELATED: Australia’s big dole myth busted

The red bars should not include JobKeeper (the $1500 wage subsidy), because that is paid to businesses who then pay their staff. JobKeeper does affect the graph though: The blue bars would have fallen much further without it.
Now let me explain an annoying technical detail of the chart, because the red bars and blue bars are a bit confusing. You can’t just read their values off the side of the chart. The size of the red and blue bars is their contribution to the height of the black line, not their absolute change. To lift total incomes by 6 per cent, welfare has to go up much more than 6 per cent (because it is only a small share of total incomes).
While wages and salaries have fallen (we know from other data they are down about 6 per cent compared to early this year) welfare has increased enormously, up about 300 per cent.
RELATED: Economic ‘bloodbath’ coming in 100 days

This fact is hard to wrap your head around. The government has not just boosted welfare a little bit. It has boosted it enough to more than compensate Australia for the lost wages in this recession. I found it hard to believe at first. My scepticism was reduced, however when the latest retail sales data came out.
In this recession, retail spending has apparently gone up. Another topsy turvy result. In May, in the height of the pandemic, with lots of shops closed, Australians spent more money than usual, as the next chart shows.

In March we stocked up, in April we stayed home, in May I expected things to balance out. Instead there was a surprise jump in spending. One explanation for this is that on aggregate, thanks to the $750 payments and the much higher JobSeeker payment, Australians actually have more money to spend than usual. It will be very interesting to see if this new higher rate of spending continues in June. That data comes out in a couple of weeks.
WHAT THE GOVERNMENT MUST DO NOW
What this surprising chart tells us is just how important government spending has been to keeping the economy from being even worse. If the private sector isn’t spending, the government must. They’ve done that, and done it big time. Not just replacing missing incomes, but adding a bit extra to help compensate for the fear and nervousness. Credit to the Government for this. They are helping a lot.
Once we understand that, it raises the stakes massively on what to do with JobSeeker and JobKeeper in September. The Treasurer is scheduled to deliver a mini-Budget later in July, and if he slashes spending so incomes actually fall in total across Australia, that’s when we will get the traditional recession effect, with companies going bust and jobs being lost.
The trick will be to ramp the support down slowly. Let the red bars in the graph shrink only when the blue bars are rising. Otherwise the black line will fall and we will all be worse off.
Jason Murphy is an economist | @jasemurphy. He is the author of the book Incentivology.


