
Graph reveals worrying sign for the economy
For the average household things have scarcely been worse since records began in the 1970s, as the economy enters a dangerous and familiar phase.

In the wake of the release of the recent federal budget, a broad consensus has emerged that the Albanese government’s plan is stimulatory and inflationary to at least some degree.
This comes amid a backdrop of the RBA engaging in the swiftest and largest relative tightening in monetary policy in the nation’s history.
Across much of the nation, state governments are also injecting extra cash into their respective economy’s. In Western Australia, the state government’s electricity subsidy will continue for another year, providing households with $400 toward their bills during 2024-25.
In Queensland, Premier Steven Miles is pulling out all the stops ahead of the state election in October. Mr Miles has announced that all Queensland households will receive $1000 toward their electricity bills from July and that for six months from August, public transport trips will cost just 50 cents.
The current settings in the Australian economy have become a perfect example of what I like to call burnout economics. This is a term I coined back in early 2022, as it became clear the pandemic had dramatically changed the relationship between policymakers, the electorate and central banks.
In short, government at a state and federal level have their foot jammed on the economic accelerator, while the Reserve Bank is furiously trying to put on the brakes in order to contain inflation. Like a real-life burnout, there is a lot of smoke, a lot of noise, a rising chance something will break and not a whole lot of forward momentum.
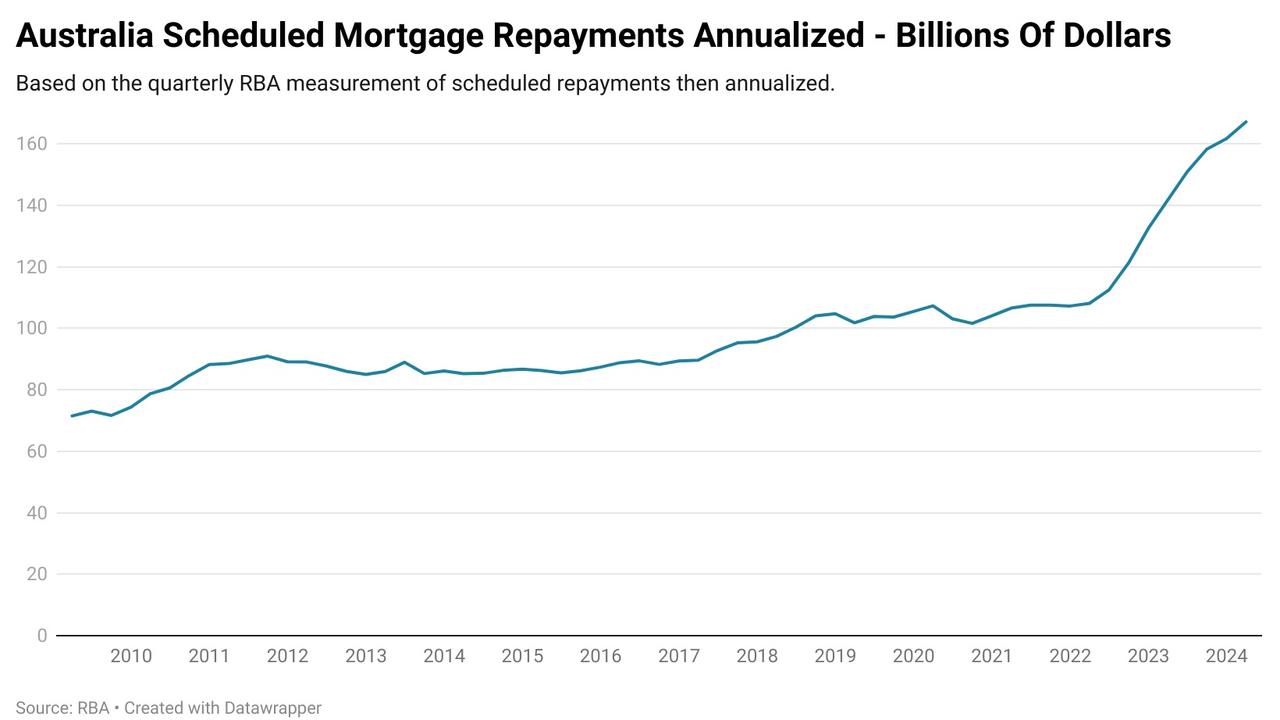
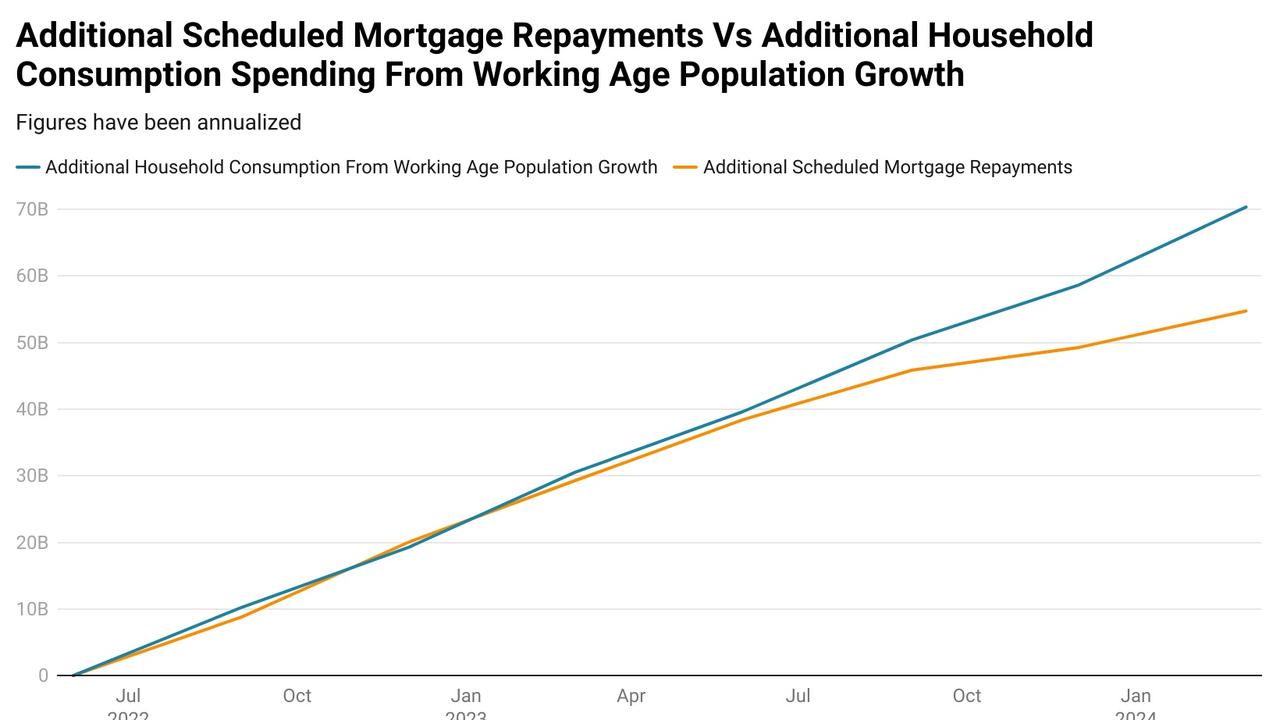
But there is more to it than government spending more on one side of the ledger and the RBA trying to reduce the amount of cash in the economy on the other. Compared with where they were prior to the kick-off of the current rate rise cycle, scheduled mortgage repayments have risen by $54.7 billion per year on an annualised basis.
However, since rate rises began in May 2022, the nation’s working-age population (aged 15 or over) has expanded by 1.14 million people. Assuming an average level of household consumption spending per additional working age individual, this has added about $70.3 billion a year on an annualised basis.
While previous RBA tightening cycles have seen strong working-age population growth, this current one is unique. It is by far the largest expansion of the working-age population and it is overwhelmingly driven by the migration of adults who are likely to be employed. This is quite a contrast to previous cycles, where a majority of the expansion has been driven by the existing population turning 15.
This unique set of circumstances has put downward pressure on wages, which does and will continue to reduce the inflationary impact of this particular driver of price pressures. But in the short term, it has significantly increased the level of aggregate consumer demand in the economy at a time when the RBA is attempting to reduce that demand, acting as a third major driver in the burnout economics triangle.
The result
It’s here the experience of the average Australian household and the headline performance of the economy go their separate ways. On paper, the nation’s economy has managed to dodge yet another recession, at least so far. But for the average household, by some metrics things have scarcely performed worse since immediately comparable records began in the mid-1970s.
In terms of GDP per capita, the nation is currently enduring its longest recession since records began, experiencing eight consecutive quarters of contracting per person economic outcomes. While the severity of this fall has so far been relatively contained compared with the recessions of the past, there is no end in sight for the weakness of the economy at a per person level.
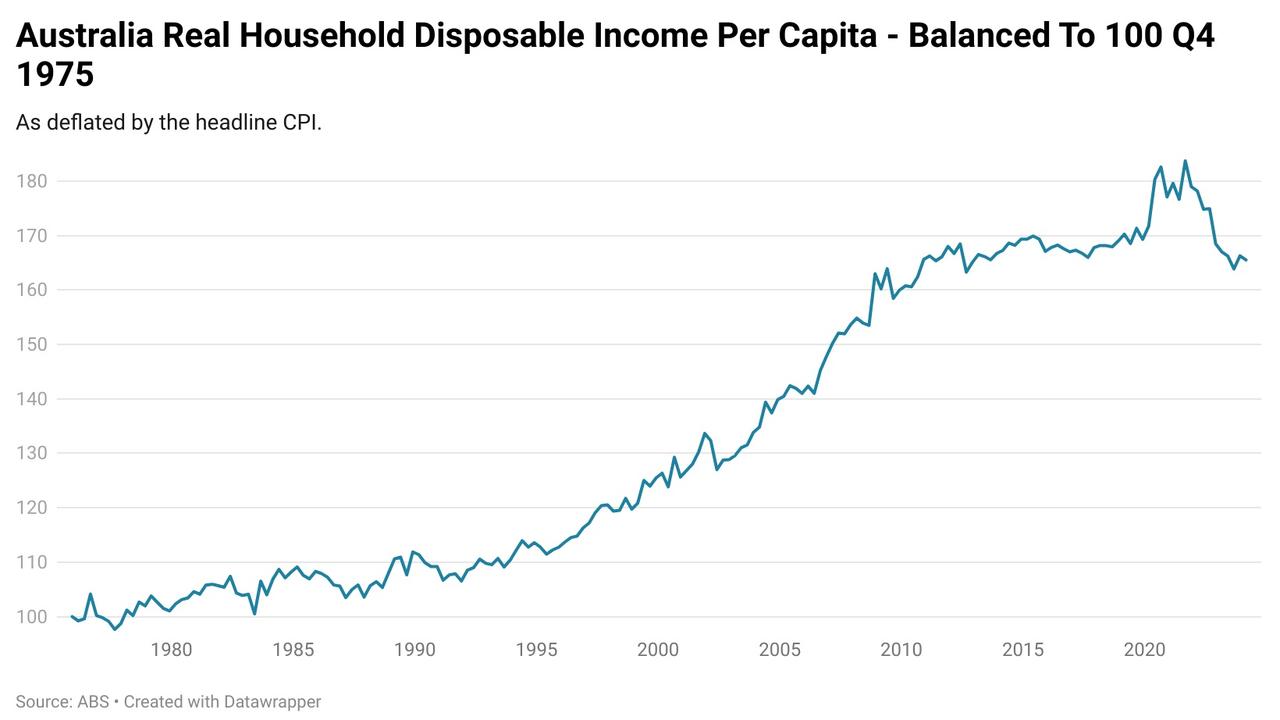
Since comparable records began in the early 1970s, there have been three major declines in inflation adjusted per capita household disposable incomes during recessions, 1974-75, 1981-1983 and 1990-1991. During those recessions, the largest prior decline in this metric occurred from 1981 to 1983, where it fell by 5 per cent.
Since peaking in the September 2021, real household disposable income per capita fell by a maximum of 10.8 per cent which occurred in September 2023. It has since recovered to a total fall of 9.9 per cent as of the latest national accounts.
Since the ABS Wage Price Index began in 1997, wages have only declined significantly when compared against inflation on one occasion prior to the current economic cycle, in 2000 following the inflationary shock of the introduction of the GST. However, it is worth noting that after the conclusion of the impact of the mining boom, strong real wages growth became increasingly hard to come by.

Using pre-pandemic levels as a base, real wages fell by a maximum of 5.4 per cent as of the March quarter of 2023. They have since recovered to be down 4.9 per cent from their pre pandemic level.
This leaves real wages roughly where they were in the September quarter of 2010, shedding over 13 years’ worth of collective gains.
The murky economic outlook
As messy and ambiguous the inflation outlook has become as result of various government subsidies and through what lens this will be perceived by the RBA, the economic outlook is equally murky if not more so.
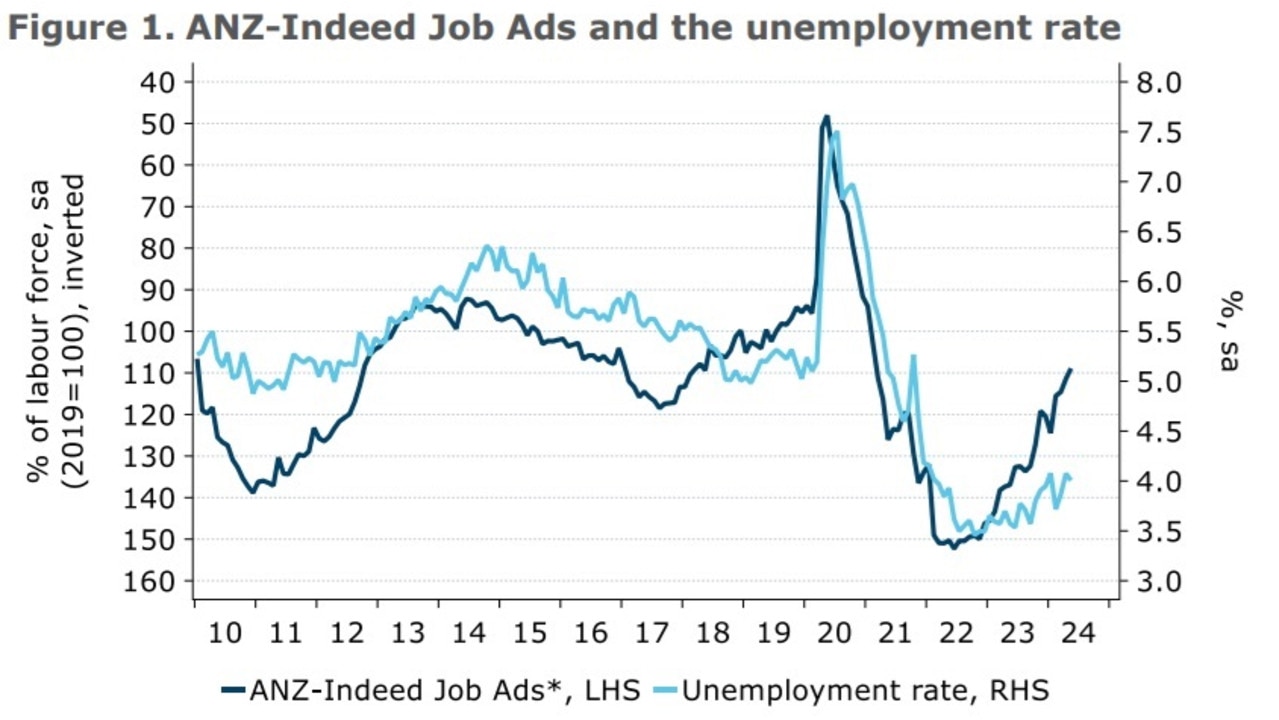
Thus far, according to figures from the Australian Bureau of Statistics (ABS) the rise in headline unemployment has been contained to a 0.5 percentage point rise to sit at 4 per cent in the latest data. But there are increasingly signs of rising risks that unemployment could surge as the economy struggles to keep up with the extremely high rate of labour force expansion.
This chart from the recent ANZ-Indeed Job Ads report is arguably the best illustration of that so far, with the decline in job ads pointing to a significantly higher unemployment rate.
Whether households in aggregate will spend or save their windfalls from the various tax cuts and subsidies stemming from the Albanese government and its state government counterparts is unclear. This has led to quite a divergent set of possibilities being put forward by economists, both with potential upsides and downsides.
A failed strategy
Burnout economics has been pursued by the Albanese government inadvertently or otherwise, along with an extensive list of other governments from both sides of the political divide throughout the developed world.
While a recession has so far been avoided, along with the much higher level of unemployment that generally comes with it. When it comes to metrics that are defined by the performance of the economy at an individual household level, some have seen a decline in living standards (as measured by real household disposable income per capita) worse than every recession in the last 50 years.
The rising risk now is that as the economy continues to slow and the extremely high levels of migration supporting headline growth begin to fade, the nation’s economy could end up falling into a recession anyway.
On the other side of the coin the large injections of additional cash from the federal government and selected state governments may end up helping to keep the economy out of recession, but there are concerns that this could result in inflation and interest rates staying higher for longer.
Ultimately, its something of a Catch-22 set of circumstances where no option is truly ideal, only less worse than the alternative, or so the policymakers pursuing that option hope it will be.
Tarric Brooker is a freelance journalist and social commentator | @AvidCommentator

Warning ‘nervous’ RBA could hold rates
The Reserve Bank’s monetary policy board “clearly remains nervous about inflation”, with a major bank warning a rate cut is not a lock in August.

Why unemployment may stop rate cut
The RBA boss has given another major clue as to why the central bank held interest rates during their July meeting, and what will move the needle in August.

RBA boss makes grim prediction
The Reserve Bank has revealed the reason behind its shock decision to hold the cash rate, leaving homeowners waiting a bit longer for much-needed relief.