
Horror graph reveals hidden economic nightmare
A major part of the Australian economy is lagging, and it spells disaster for thousands of Aussies.

ANALYSIS
The retail economy has once again been making headlines for all the wrong reasons, with the latest ABS statistics showing an unexpected 0.4 per cent fall in spending for April in stark contrast to the 0.2 per cent expansion expected by analysts.
Ben Dorber, the head of the ABS Retail Statistics, explained that with cost of living pressures high, consummers were pulling back on spending.
It’s the weakest growth on record, he added, outside of the pandemic and introduction of GST, with retail turnover flat for the past six months.
Considering this metric does not account for population growth or inflation, this paints a concerning picture for the nation’s retail sector. In the last 41 years things have never been this bad in nominal terms outside of distortions created by shock events.
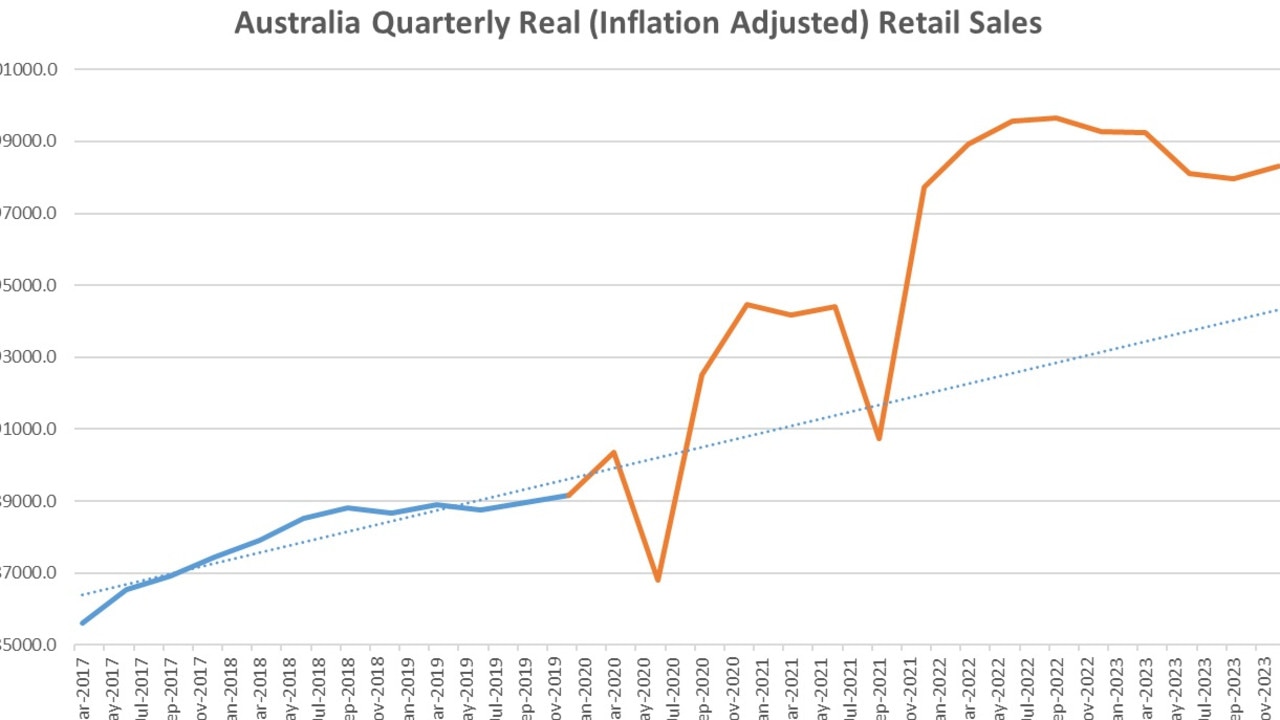
If we were to chart the path of inflation adjusted retail sales from two years prior to the pandemic and then extrapolate out the trend present in the data until the present day, it reveals that on this basis we are well ahead of where we would have been if the pre-Covid trend continued.
Sick and sicker
On the face of it having inflation adjusted retail sales in aggregate above the pre-Covid trends sounds pretty good. Overall sales are at a level that retailers could have only dreamt of at the end of 2019 when the retail economy was in the doldrums.
But that is really not much of an achievement. In the two years prior to the pandemic, inflation adjusted retail sales were growing at an average of just 0.99 per cent per year, below the 1.5 per cent average rate of population growth.
While retail sales sit 5.2 per cent higher than they otherwise would have if the pre-pandemic trend had continued, when we start looking at what they have done since peaking immediately following the pandemic and start accounting for the impact of population growth, things begin to look even worse than during the height of Covid by some metrics.
But when contrasted with where retail sales were at the end of 2022, things look quite a bit more concerning. Since the September quarter of 2022, inflation adjusted retail sales have fallen by 1.36 per cent.
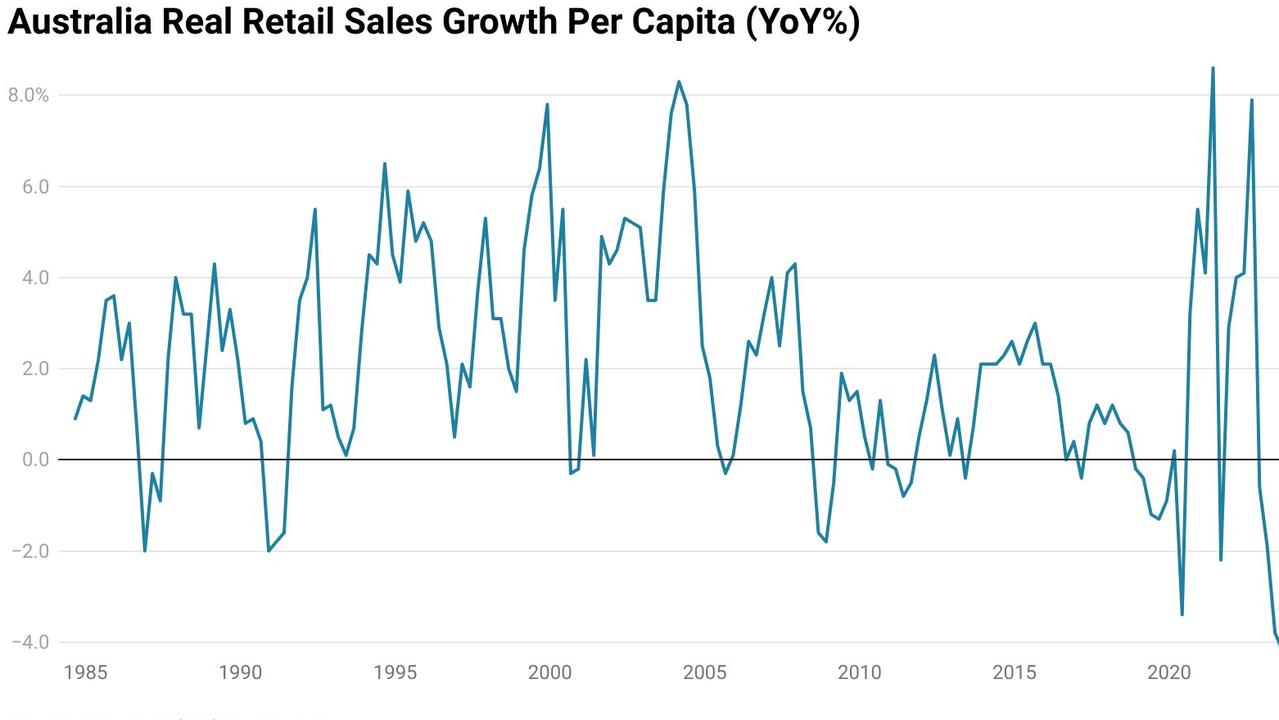
In per capita inflation adjusted terms, retail consumption fell by 3.6 per cent in the last 12 months, which is a slight improvement of a 4.2 per cent contraction seen in the September quarter of 2023. Either one of these data points and those in between represent what was prior to 2023 the worst per capita real retail sales figures in Australian history.

Considering records encompass multiple deep recessions including one that saw unemployment rise into double digits to the highest level since the Great Depression, it illustrates that households have tightened their belts dramatically.
Retail employment levels not impacted yet
Despite experiencing by far the worst falls in per capita inflation adjusted terms since records began in 1983, so far, the reduction in the number of workers in the retail sector is no where near as severe as previous recessions and economic downturns.
In year-on-year terms, the largest contraction in the retail workforce occurred during the December quarter of last year, at which time the number of workers was down 2.8 per cent. To what degree this has been impacted by the changing pattern of consumer retail spending due to Black Friday and its ongoing effect on retail hiring is unclear.
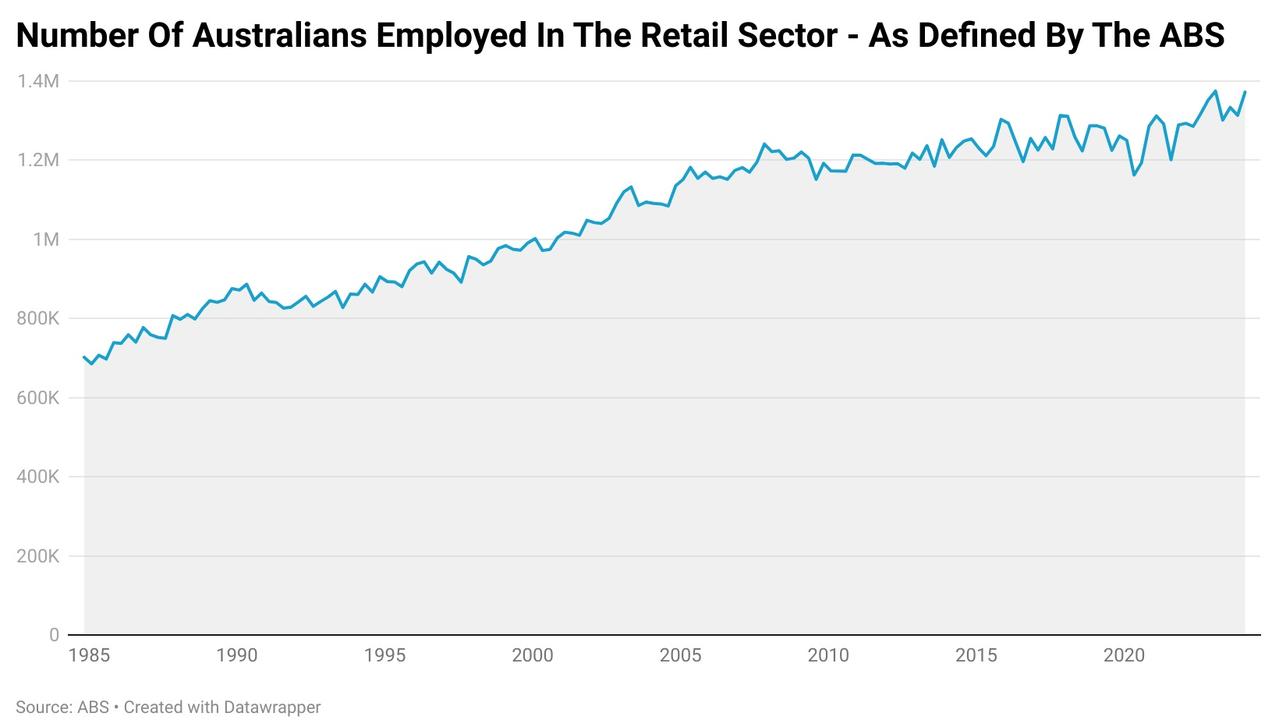
When compared to the peak 5.2 per cent year-on-year drop in retail staff levels during the 1990s recession, which occurred due to seven straight quarter year-on-year declines in the retail work force, circumstances are actually remarkably rosy for this element of the labour market in relative terms.
The outlook
Amidst the upcoming impact of the Stage 3 tax cuts, the winding back of HECS indexation and other various stimulatory measures coming from government at both a state and federal level, the hope is that these factors could put a spring in the step of the retail sector in the second half of the year. If the RBA is in fact done raising rates for this cycle, the overwhelming majority of the total impact of tightening monetary policy is already being felt on household budgets.
On the other side of the coin, the median payable rent nationally was recently estimated at $435 per week based on ABS figures. Meanwhile, a recent CoreLogic report found that the national median asking rent was $627 per week.
To what degree the ABS metric is playing catch up is a matter of debate, but if we take both figures at face value, once payable rents eventually catch up with asking rents as they have historically over time, that equates to renters eventually paying an additional $29 billion a year in rent.
Considering that is more than half the total impact of rising mortgage rates based on the increase in scheduled repayments, the impact of rising rents will remain a headwind for the retail sector for years to come.
Arguably the biggest question going forward is the state of migration. If migration is reduced in line with Treasury’s forecasts in the mid-year budget and the recent RBA modelling, then by years end the size of the migration intake will have almost halved from its 2023 peak.

If we apply the average rate of per capita working age (aged 15+) household consumption, this would represent roughly a $12.9 billion reduction in annual consumption relative to where it would have been if the 2023 level of migration continued.
On the other hand, if migration once again defies Treasury forecasts and remains higher than expected, this could benefit the retail sector, but at the same time puts upward pressure on aggregate demand and by extension inflation.
Ultimately, even with the wind of inflation and record high population growth at its back, the retail sector is performing more poorly now than any other time in the last 40 years, excluding the pandemic and the introduction of the GST.

Young Aussie finds big parking fine loophole
This Aussie student is taking his $97 parking fine to court because he wasn’t given the option to pay cash at the meter.

Aussie dollar climbs to 9-month high
Record-breaking Aussie dollar could smash through 66 cents this week as markets await make-or-break trade deals and inflation data.

Claims $776m spent on Treaty negotiations
The Victorian government has hit back at “cherry-picked analysis” that claimed it has spent more than $776 million on treaty negotiations.