
Sydney house prices rise but there’s a catch
All Aussies states but one have seen house prices rise but there’s a big catch in which properties have seen a bump.

At the beginning of May last year, the Reserve Bank embarked on the largest and swiftest rise in interest rates in relative terms in the nation’s history. While rates have risen almost as quickly in the past, particularly during the high inflation periods of the 1970s and 1980s, they were rising from a much higher base and household debt was a small fraction of what it is today.
Unsurprisingly by some metrics, we have seen the largest falls in house prices in the more than 40 years of immediately comparable data there is at hand.
Where house prices are falling most
Of the largest capital cities, Sydney has so far fared the worst, down 12.6 per cent from its peak in February of last year. The smallest falls so far have been experienced by Perth, down by just 0.6 per cent.
At a five capital city aggregate level, prices are down 9.3 per cent since its peak in May last year, ironically just a few days after the rate rise cycle began.
But in recent weeks the housing markets in some of the capitals began to shift. Part of this move is down to the seasonal demand that surges this time every year, which I covered in more detail in a prior article.
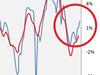
However, in Sydney the move has significantly exceeded what could be readily attributed to seasonality. So far in March, according to CoreLogic, Sydney housing prices have risen by 1.16 per cent, followed by Perth posting a rise of 0.43 per cent. At the other end of the spectrum, housing prices in Adelaide have continued to fall down 0.1 per cent, but falls have moderated significantly.
Outside of Sydney and Perth, the moves so far have not been out of step with seasonal moves over the past decade. But in Sydney in particular, it’s worth examining what’s going on within the market that could be driving this level of reversal in prices amid a backdrop of higher interest rates.
The top end vs the bottom end
During February, Sydney posted a 0.3 per cent increase in housing prices overall. But when one begins to look at the breakdown of that figure, it becomes clear that things are more complex than they first appear.
For example, in the lowest quartile of Sydney houses (the bottom 25 per cent of housing stock by value) prices fell by 0.5 per cent in February. To put this figure into a bit of perspective, the bottom quartile of Sydney housing prices is houses under $895,000. Sydney units in this quartile also saw continued falls in February, down by 0.3 per cent. This metric is based on units at a value of $599,000 or under.
At the top end of the market in the upper most quartile which covers the 25 per cent most expensive houses in Sydney, which starts at a price of $1.86 million, the story is the polar opposite. These houses rose in value by 0.8 per cent in February, with their unit counterparts posting a rise of 0.3 per cent.
At a capital city level the same trend was present, the top quartile performing significantly better than the bottom quartile, but it was a far less potent force and arguably heavily driven by the impact of the Sydney market.
Collapsing listing volumes
During what is normally the spring selling season for the property market, last year a strange event occurred, there was no surge in new listings coming out of winter. In fact, spring actually had weaker volumes of new listings than winter for the first time in at least the last decade, possibly significantly longer.
Since then things have not improved, instead new capital city listing volumes have remained significantly below the already depressed five year average, currently sitting 12 per cent below the five year average.
Meanwhile, the overall number of properties for sale in the nation’s capital cities sits at its lowest level since at least 2012, providing the market with a near unprecedented level of support from such a low level of available supply.
Despite depressed listing volumes at a capital city and national level in aggregate, there are capital cities bucking this trend of a strengthening property market and collapsing listing volumes.
In Darwin, Hobart and Canberra new listings are up by 6.2 per cent compared with the five year average. Unlike most of the other capital cities, prices are still falling in these locales, lending weight to the idea that low new listing volumes are supporting some markets significantly.
A recent report on listing volumes that we could be seeing a build-up of pent up supply and that these prospective vendors may list their property for sale at a later date noted CoreLogic.
Putting it all together
For some of the more affluent Australians who are less sensitive to higher interest rates, the current downturn in housing prices has seemingly been seen as an opportunity to pick up a home for discount on peak prices, particularly in areas where prices have come down far more than the capital city aggregate would suggest.
So far this is supporting the Sydney market significantly and may in time spread to other capitals depending on how circumstances unfold from here.
Meanwhile, the collapse in new listings throughout markets across much of the country is providing the housing market with an unexpectedly large degree of support. Despite rising mortgage rates and levels of mortgage stress, so far there is little sign this will bring more properties to market in the immediate future.
Ultimately, it’s an increasingly complex picture for the Aussie property market, with somewhat unexpected forces coming to its aid, while it attempts to weather the storm of higher interest rates and a slowing economy.
Tarric Brooker is a freelance journalist and social commentator | @AvidCommentator

‘Good enough’: Experts’ huge rate call
Mortgage holders are expected to get some much-needed rate relief in August after inflation fell to its lowest level in more than three years.

‘Make them pay’: Algal bloom storm grows
Protesters tried to confront the CEO of South Australian oil and gas giant Santos on Wednesday, demanding money to clean up the state’s algal bloom disaster.

Young Aussie finds big parking fine loophole
This Aussie student is taking his $97 parking fine to court because he wasn’t given the option to pay cash at the meter.