
Graph reveals the age group that spends the most
The data shows an economy where traditional consumption patterns have been flipped on their head, and there’s an age group that’s thriving.

Consumer data has provided a fascinating insight into the spending power of different age groups, fuelling the debate on which Australians are driving inflation and benefiting from the status quo.
The latest figures on spending by age demographic once again confirmed what many are seeing on the streets, in the shopping centres and in our own backyards: that inflation-adjusted spending growth is driven by older demographics.
The data reveals an economy where traditional consumption patterns have been flipped on their head.
For example, individuals over 75 are spending more on non-household bills and goods than those aged 25 to 29.
It’s a similar story for 70- to 74-year-olds, who are now spending more per capita than those aged 30 to 34.
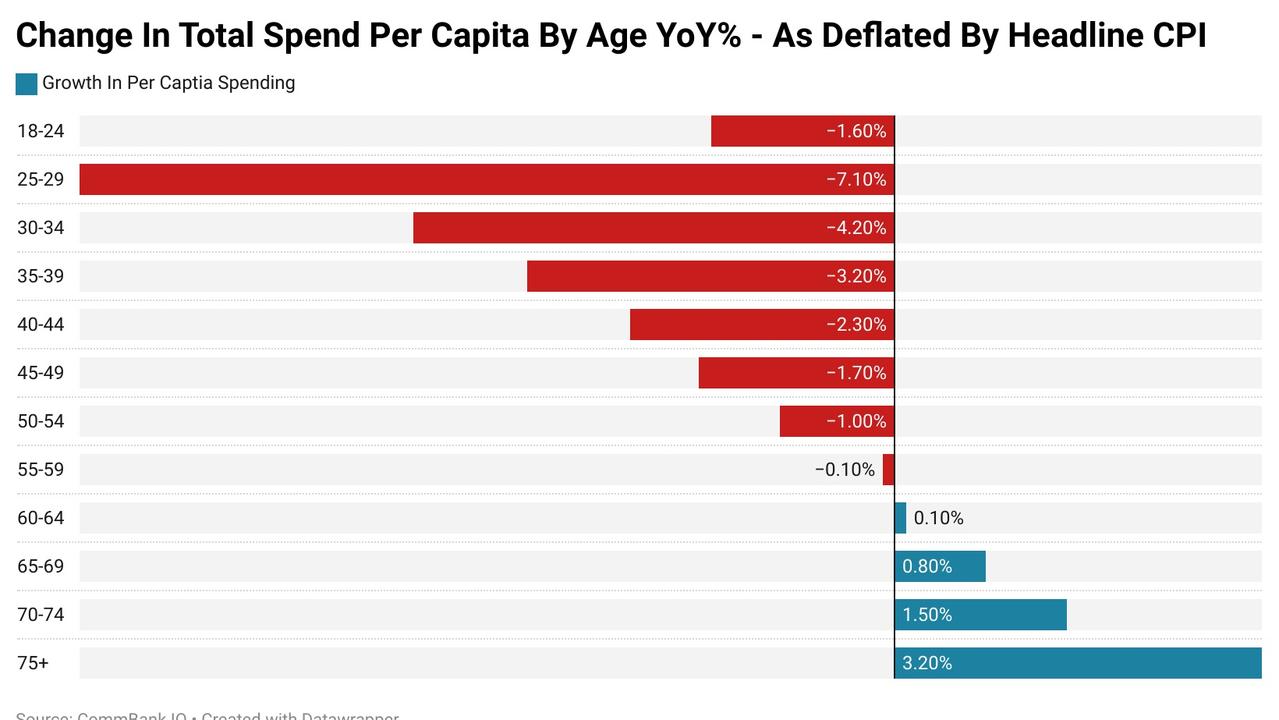
Every age demographic under the age of 60 saw their consumption fall in inflation adjusted terms in the last 12 months of data.
The strongest rise in real spending was seen in the 75 and over demographic, up by 3.2 per cent, followed by the 70 to 74 age range up by 1.5 per cent.
At the other end of the spectrum, the demographic which saw its spending hardest hit was 25-29, which saw its spending fall by over 7 per cent in inflation adjusted terms.
Intended consequences
As boomers and other older demographics increasingly face criticism for their role in driving inflationary pressures, it’s worth noting that this spending growth is actually a sign that government policy decisions made over 30 years are going according to plan.
It has been the plan of successive governments from both sides of politics for decades that superannuation be used to support a better standard of living in retirement and in theory be a cost-effective means of reducing expenditure on the aged pensions further down the road.
In the words of several former prime ministers:
“Superannuation isn’t a drain on the economy; it’s a vital engine for growth”: Julia Gillard.
“Superannuation is a cornerstone of our economic framework. It encourages savings, drives investment, and ultimately supports consumption”: Tony Abbott.
“Superannuation isn’t just about securing retirements; it’s about fuelling economic growth. As more Australians contribute to their super, it injects capital into the economy, fostering investment and driving consumption”: Kevin Rudd.
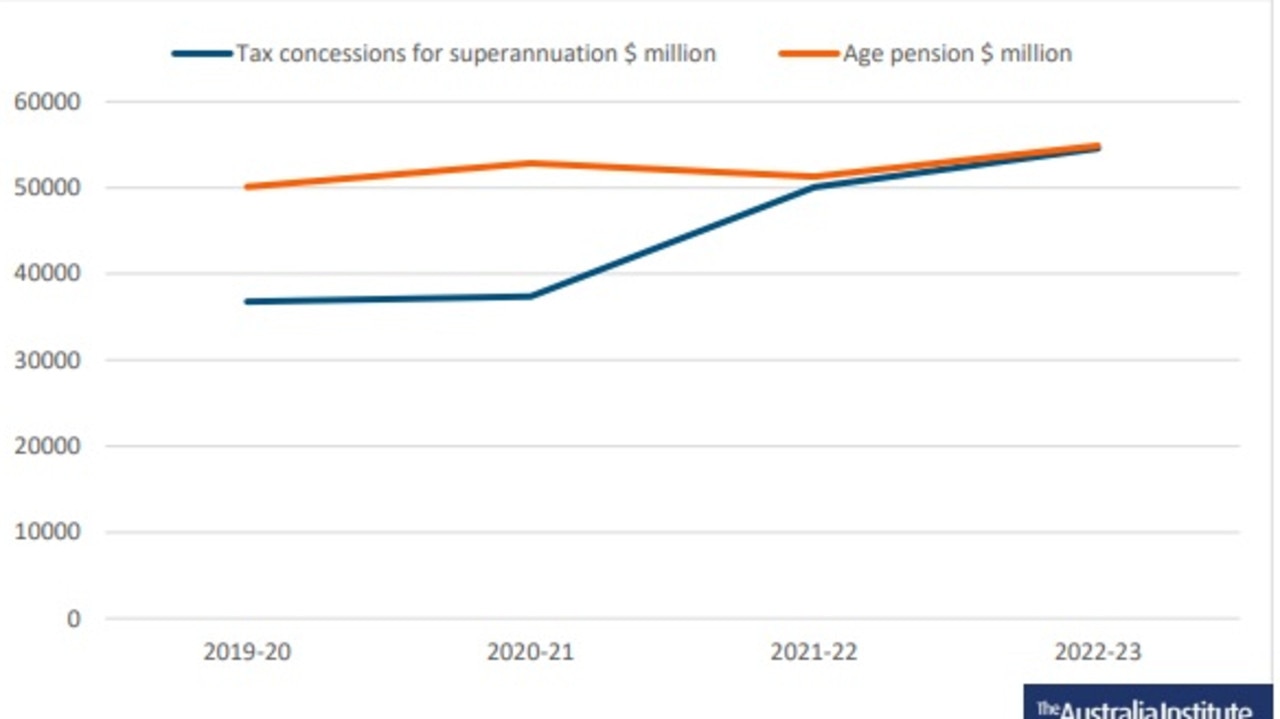
The benefit of superannuation as it stands to the federal government coffers is increasingly being drawn into question.
The majority of eligible Australians over the age of 67 are still recipients of the age pension and the scale of superannuation tax concessions is approaching a similar annual cost to the budget as the age pension itself.
An unintended mess
This has left the nation is a rather challenging and unenviable position.
On one hand, the recent cohort of retirees in aggregate is more affluent and has greater incomes than any generation before them, delivered to them through decades of rocketing property prices and a longer duration with which to build wealth in super, and they are spending accordingly.
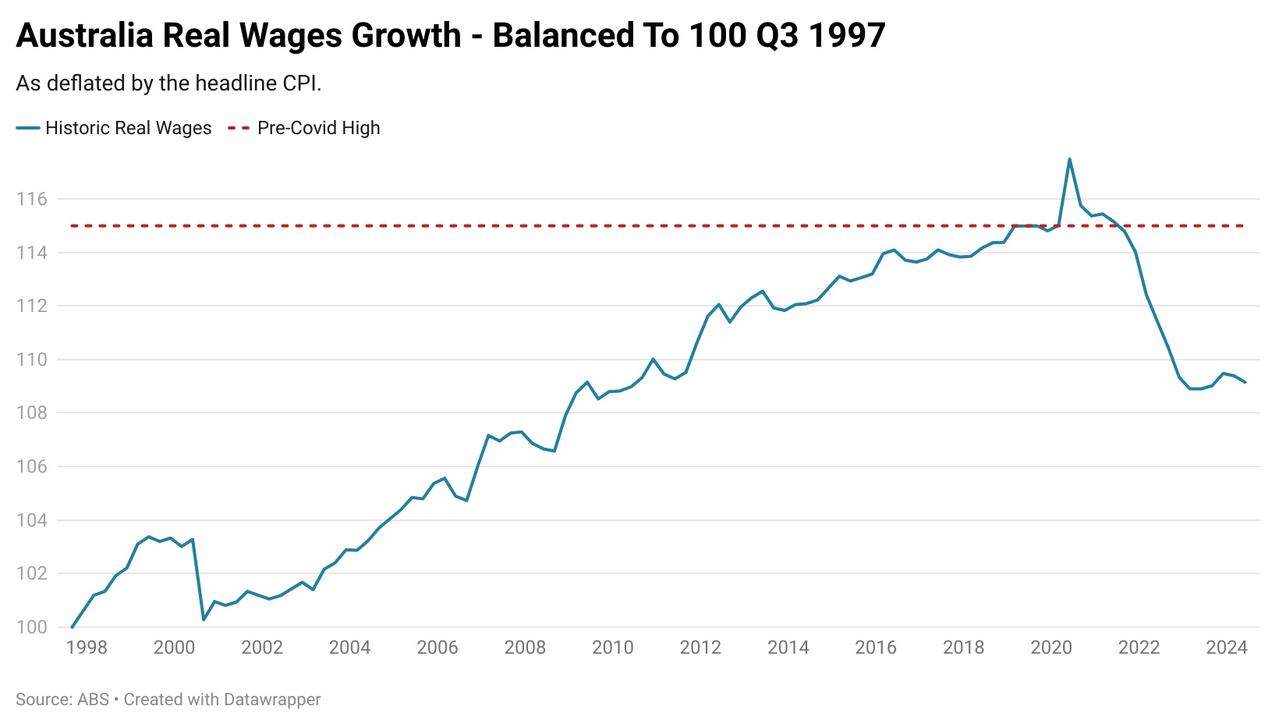
On the other hand, in the last three years working age Australians have experienced the worst decline in real wages on record, seeing 15 years’ worth of growth erased.
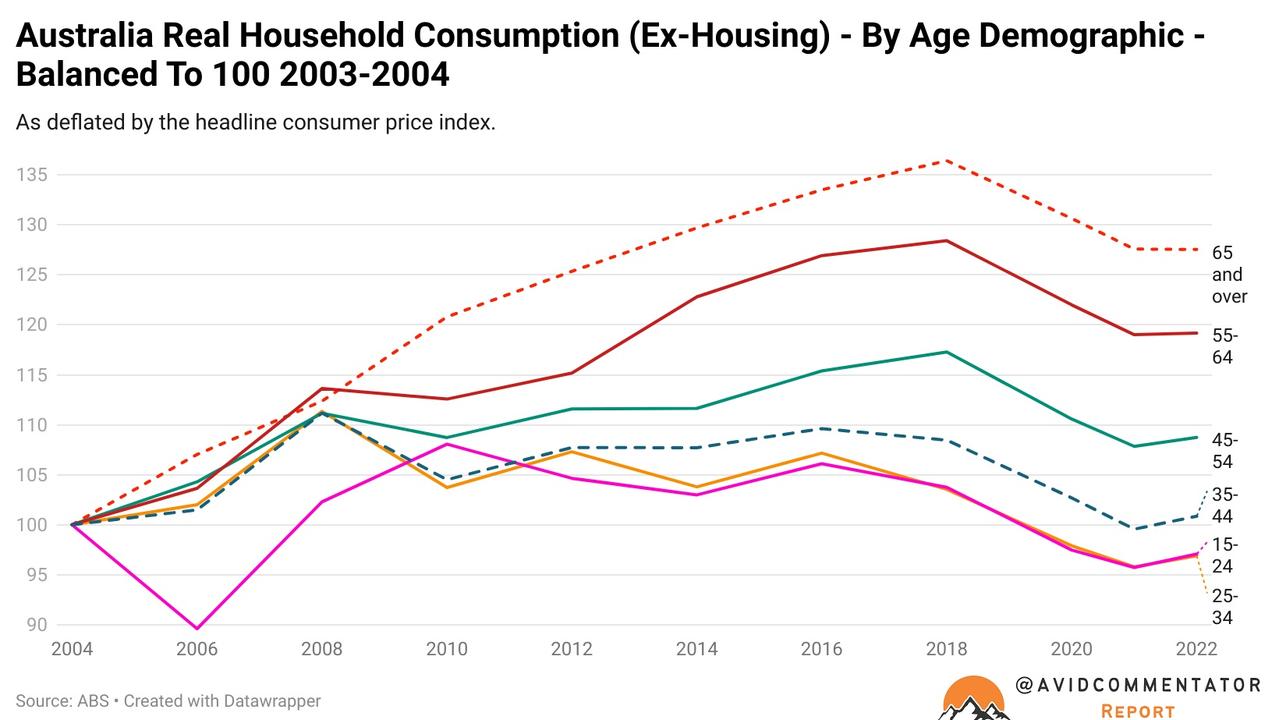
But the issues faced by working age Australians go back further than the current inflation cycle and unfortunately run far deeper. Excluding housing costs, real household consumption for 15-24s and 25-34s was lower in 2021-22 than it was in 2003-2004, almost two decades earlier.
The 35 to 44 demographic performed slightly better up by 0.85 per cent. For the highest earning demographic, households aged 45 to 54, real spending grew by only 6.2 per cent and is 7.3 per cent below where it was 2017-18.
Meanwhile, real spending for older demographics was much stronger, up 19.2 per cent for 55 to 64s and 27.6 per cent for those aged 65 and over.
Policymakers have a problem
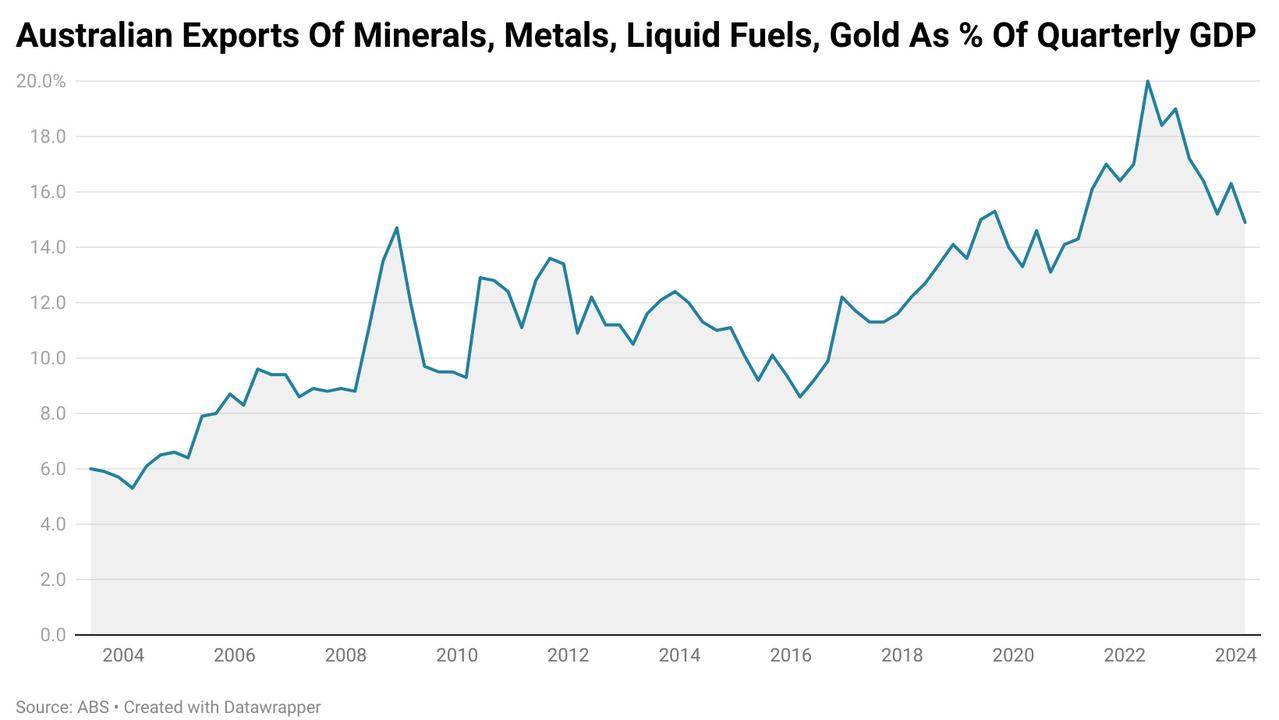
Since 2003, lady luck has delivered Australia multiple mining booms, rocketing commodity prices in two separate instances that came just when we needed them; global financial crisis, and at one point the crown for the largest exporter of liquefied natural gas (LNG) in the world.
Yet aside from larger super balances and more expensive houses, Australians under the age of 45 in aggregate have remarkably little to show for it compared with their forebears. Even for under 55s the growth in real household consumption excluding housing has been at best anaemic, despite this demographic holding the largest number of beneficiaries of inheritances according to data from the federal government’s productivity commission.
It would be easy to lay the blame at the feet of the pandemic, but the reality is real consumption excluding housing spending peaked for households aged 15 to 24 in 2010, for those aged 25 to 34 and 35 to 44 in 2008. This is an issue that is deeply rooted in our economy and our society.
Without some form of external shock to asset markets or a major hit to the housing market, government policy has effectively ensured that over 60s will only continue to get more affluent and consume more in aggregate. Whereas at the working age end of the spectrum, most households in aggregate are either going no where or going backwards.
For more than a decade, rising wealth through growth in house prices and high levels of migration have helped to mask this profound weakness at the core of what was the main driver of consumer economy.

The big question for policymakers and broader Australian society going forward is how long are working age households going to continue to quietly accept the status quo?
Even as other demographics streak ahead with their levels of consumption.
Tarric Brooker is a freelance journalist and social commentator | @AvidCommentator

Aussie dollar climbs to 9-month high
Record-breaking Aussie dollar could smash through 66 cents this week as markets await make-or-break trade deals and inflation data.

Claims $776m spent on Treaty negotiations
The Victorian government has hit back at “cherry-picked analysis” that claimed it has spent more than $776 million on treaty negotiations.

ASX drops on banks and miners
Falling iron ore prices and profit taking on the major banks drove the ASX lower on Friday for the third straight trading day.