
AFL Grand Final: Footy fans putting bladders to the test in Grand Finals
We know footy fans go to extreme lengths to support their team, however new research shows supporters are putting their bladders through hell in close Grand Finals. See the bizarre findings.
VIC News
Don't miss out on the headlines from VIC News. Followed categories will be added to My News.
Tight finishes in AFL Grand Finals are putting nerves and bladders to the test as people hold on until after the siren to race to the loo.
Melbourne Water said it recorded a significant spike in water use during breaks in play and post-match.
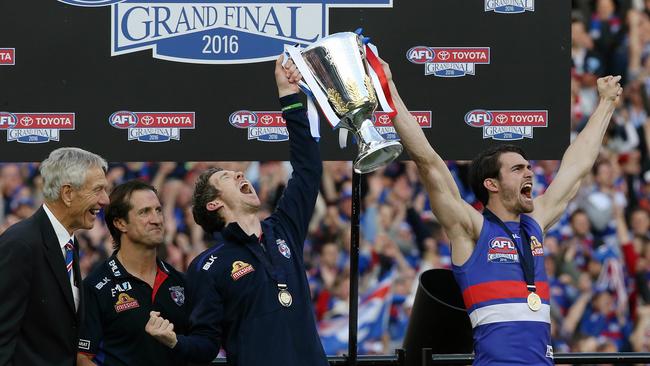
The “flush factor” was most notable during nail biters, including last year’s game when West Coast clinched a five-point come from behind win over Collingwood.
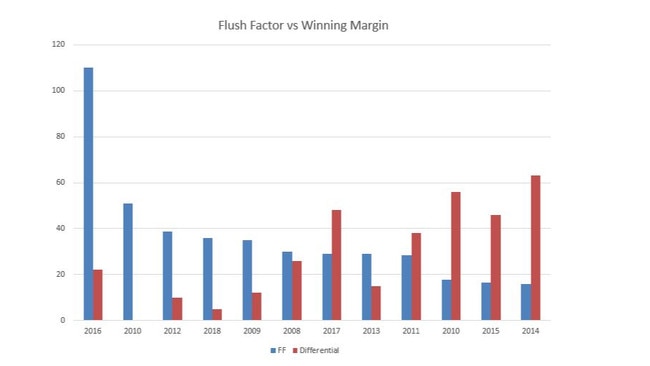
Figures comparing the last 12 Grand Finals found the Bulldogs’ drought-breaking victory over the Swans in 2016 resulted in the biggest change in water levels.
The 2010 Collingwood St Kilda draw was second, followed by Sydney beating Hawthorn in 2012 and the Eagles 2018 win.
Blowouts in scores correlated with less of a jump, with Hawthorn’s 2014 and 2015 victories by 63 points and 46 points respectively, ranked the lowest on the flush factor scale.
Richmond’s 2017 triumph was ranked 7th.
Melbourne Water’s water operations centre team lead Dave White said having the Tigers return to the big stage would add to the hype, while GWS have come in off the back of two consecutive games that went down-to-the-wire.
MORE: EVERY VOTE IN THE 2019 BROWNLOW MEDAL COUNT
Mr White said it would depend on the scoreboard whether people were glued to their seats, holding on for the break.
“If it’s a close game I expect the spike to be pretty large,” he said.
“Basically the bigger the spike, the more people are delayed going to the toilet or putting the kettle on.
“There’s really no other day like this, where we have this change in flow, it’s just the Grand Final.”
FLUSH FACTOR RANKINGS FROM THE LAST 11 YEARS
1 Western Bulldogs def Sydney 2016 — flush factor of 101 per cent change in flow
2 Collingwood St Kilda Draw 2010 — flush factor of 51 per cent change in flow
3 Sydney def Hawthorn 2012 — flush factor of 39 per cent change in flow
4 West Coast def Collingwood 2018 — flush factor of 36 per cent change in flow
5 Geelong def St Kilda 2009 — flush factor of 35 per cent change in flow
6 Hawthorn def Geelong 2008 — flush factor of 30 per cent change in flow
=7 Richmond def Adelaide 2017 — flush factor of 29 per cent change in flow
=7 Hawthorn def Fremantle 2013 — flush factor of 29 per cent change in flow
9 Geelong def Collingwood 2011 — flush factor of 28 per cent change in flow
10 Collingwood def St Kilda 2010 — flush factor of 101 per cent change in flow
= 11 Hawthorn def West Coast Eagles 2015 — flush factor of 16 per cent change in flow
= 11 Hawthorn def Sydney 2014 — flush factor of 16 per cent change in flow
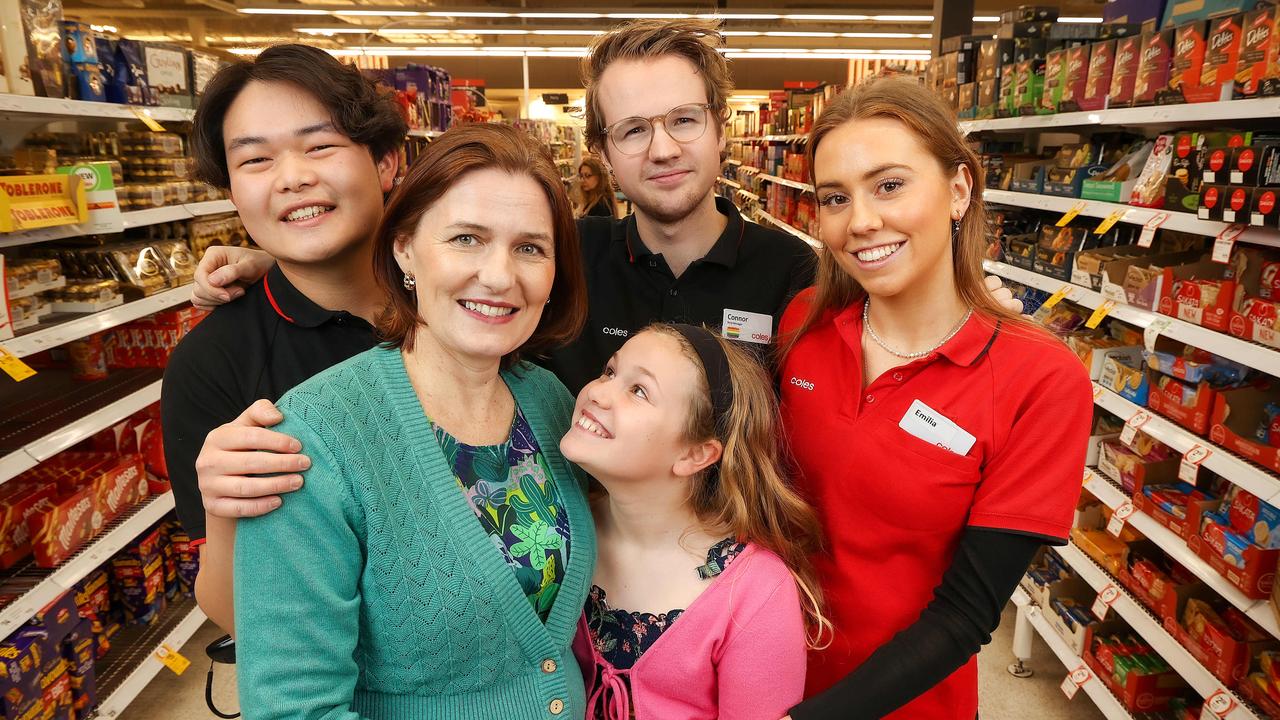
‘Angels’: Hero Coles workers save mum’s life
A mother of three has opened up on how her life was saved after she suddenly collapsed while doing a routine supermarket shop.

Wildlife and traffic fears over music festival
Wildlife advocates fear a weekend music festival in central Victoria will endanger native animals including rescued joeys.