
ASX Trader: This rare market signal often foreshadows a crash - it’s flashing now
This rare market signal that’s appeared before six of the biggest stock market crashes in history is back and it’s sounding the alarm, writes ASX Trader.

Business
Don't miss out on the headlines from Business. Followed categories will be added to My News.
A rare market signal that hasn’t appeared since just before the Covid crash is back.
It comes from Dow Theory, one of the oldest tools used to understand how healthy or sustainable a market trend really is.
Even though it was developed over 100 years ago, it still offers surprisingly useful insights - especially when parts of the market start sending mixed signals.
Right now, Dow Theory’s Fifth Tenet - which says “the averages must confirm each other” - is being tested.
That simply means multiple key parts of the market should be moving in the same direction if a rally is real and strong.
And that’s not happening.
What does “The averages must confirm each other” actually mean?
Originally, this rule looked at two important stock indexes:
- The Dow Jones Industrial Average (DJI), which includes major companies that make products.
- The Dow Jones Transportation Average (DJT), which includes companies that move those products — like railroads, airlines, and shipping firms.
If both were rising, it suggested the economy was truly growing - goods were being made and delivered.
But if one was going up and the other wasn’t, it was a sign that something might be off.
Today, investors also use this idea with modern indices like:
- The S&P 500 - made up of 500 large companies, many of them global tech giants.
- The Russell 2000 - made up of 2,000 smaller U.S. companies that tend to be more sensitive to changes in the real economy.
Lately, these two have started moving in different directions - and that’s something Dow Theory says we should pay attention to.
What happened before the Covid crash — and what’s happening now
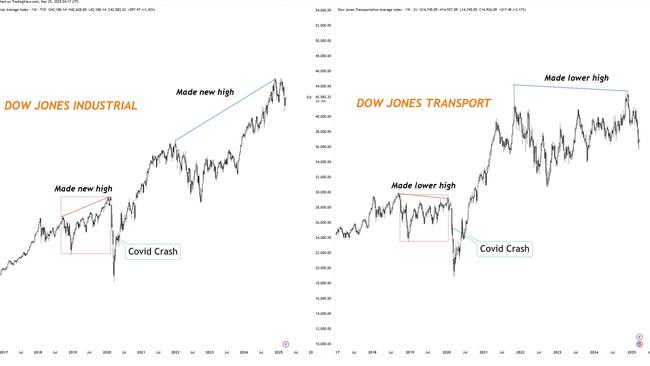
Between late 2018 and early 2020, the Dow Jones Industrial Average climbed to new highs.
But the Dow Transports never followed.
That gap - or non-confirmation - showed up months before the Covid crash.
Many didn’t notice it at the time, but in hindsight, it was a warning that something under the surface wasn’t right.
Now, we’re seeing a similar pattern.
Since the October 2022 market low, the Industrial Average has recovered strongly.
But the Transportation Index still hasn’t caught up.
Once again, the averages aren’t confirming each other.
A closer look: S&P 500 vs. Russell 2000
This same kind of split is showing up between the S&P 500 and the Russell 2000.
The S&P 500 is close to all-time highs, thanks mostly to a few very large tech companies.
But the Russell 2000 has struggled, failing to break past its high from late 2021.
Why does that matter?
That’s when the Fed began raising interest rates.
And smaller companies - like those in the Russell 2000 - are more affected by rising rates. They often have more debt and less access to cheap funding.
As rates went up, small-cap stocks peaked - and haven’t recovered since.
What’s interesting is that the S&P and Russell have usually moved together for the past 10+ years.
There are only two major times they’ve diverged:
1. Late 2019, just before the Covid crash
2. Now, since the end of the 2022 bear market
And during both times, a similar divergence also appeared between the Dow and the Transports.
Is it just a coincidence? Possibly.
But according to Dow Theory, these disconnects can be early signs of trouble.

Why small-cap stocks might send the first warning
Smaller stocks don’t trade with the same volume as the big names in the S&P 500.
That means big investors can’t sell their positions all at once - they have to slowly exit over time, to avoid moving the market too much.
It’s like a fisherman reeling in the line gently instead of yanking it.
This kind of quiet selling often starts well before the market as a whole turns down.
That’s why, in past downturns - like 2000, 2007, 2020, and even 1987 - smaller stocks and economically sensitive companies started falling first, even while big-name stocks kept rising for a while.
A look back at history
This idea of one part of the market failing to confirm another has shown up before every major downturn in the last century.
It was seen before:
- The 1929 crash
- The 1973–74 bear market
- Black Monday in 1987
- The dot-com bust in 2000
- The 2008 financial crisis
- And the 2020 Covid crash
In each of these cases, a divergence between key indices appeared before the real damage was done.
What could it mean this time?
Just because the market is diverging again doesn’t mean a crash is guaranteed.
Sometimes, the weaker index catches up.
Other times, the stronger one pulls back.
It’s not a prediction - but it’s a signal that the current rally might not be as solid as it looks.
For those learning about market structure, this is a valuable concept.
The longer these divergences last, the more they suggest that the market’s strength is being driven by a small number of stocks — not the broader economy.
When Dow Theory signals a potential market divergence - as it has now - seasoned investors don’t panic, but they do get cautious.
Here’s how professionals typically respond:
1. Exit Weak Areas
Smaller companies and cyclical sectors are often the first to falter. Many investors reduce exposure to these.
2. Focus on Quality
Capital flows toward companies with strong balance sheets and reliable cash flow. These are seen as safer bets during uncertain times.
3. Manage Risk Proactively
Traders tighten stops, lower leverage, and hold more cash - giving them flexibility if markets shift quickly.
4. Watch for Market Confirmation
If weaker parts of the market (like small caps) rebound, the danger may pass. But continued lagging is often a sign of deeper issues.
5. Add Defensive Positions
Investors may increase holdings in stable sectors (like healthcare or utilities) or allocate more to gold and bonds.
Bottom line
Dow Theory is a yellow flag, not a red one.
It doesn’t tell you when or how much the market might fall - only that the internal structure of the market is out of sync, and historically, that’s been a precursor to trouble.
The market is near all-time highs, led by a few big tech names.
But underneath the surface, other parts of the market - like small caps and transportation stocks - aren’t playing along.
According to Dow Theory, that could be a warning worth watching.
Whether you’re new to investing or just trying to understand market trends, this classic principle is a great reminder that what’s happening below the surface matters just as much as what’s making headlines.
DISCLAIMER: The content set out in this article provides general information only and should not be taken as professional advice from the publisher or author. The publisher does not endorse or recommend any product or investment opportunity referenced in the article. You should get advice specific to your circumstances before making any investment or other financial decisions.
Originally published as ASX Trader: This rare market signal often foreshadows a crash - it’s flashing now
Join the conversation
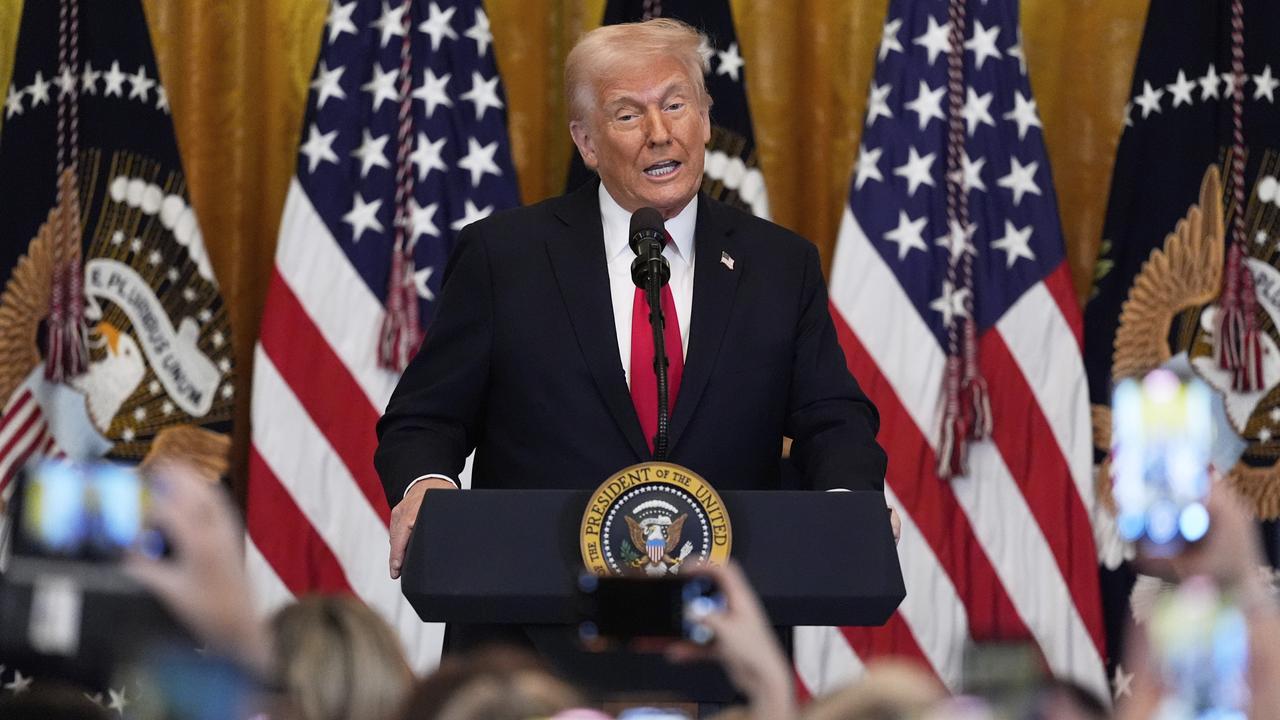
Where’s my RBA rate cut? Blame Trump’s tariffs
Australia’s central bank is trying to war game how tariffs will impact inflation and global growth. The real answer is it doesn’t know.
Read more

Want to join the gold rush? Read this first
A golden run for the popular precious metal has sent it soaring to record highs, and investors seeking a slice have several options.
Read more