
ASX Trader: Is global market on brink of massive crash?
There’s four key indicators that foreshadow a global financial crash and right now, all signals are pointing to the market teetering on the edge of meltdown, writes ASX Trader.

The American stock market may be in trouble and that could spell disaster for global financial markets.
Recent technicals suggest the market is teetering on the edge of a severe crash, with multiple valuation metrics pointing to dangerous overpricing.
History reveals it is seriously overvalued, meaning share prices are much higher than they should be based on company earnings.
If history repeats itself, this could lead to a major market crash.
Long a cornerstone of global investment, the looming crisis could have a domino effect across global markets.
Why are experts worried?
The stock market has reached a critical threshold, mirroring conditions seen before two of the biggest crashes in history - 1929 and 2000.
One key measure, the Shiller P/E ratio, which compares stock prices to company earnings over time, now stands at 37.7.
This is dangerously close to previous peaks that preceded major downturns.
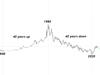
Examining the attached chart, we see the market has reached a major resistance level - a point it has only hit twice before, in 1929 and 2000.
The red circles in the chart highlight these moments, both of which also coincided with the only other times the Shiller P/E ratio surged past 30, reaching 31.48 before the 1929 crash and 44.19 at the height of the 2000 tech bubble.
Now, in 2025, with the ratio at 37.7 - more than double the average of 17 - history suggests we may once again be at a precarious turning point.

Another indicator, called the Buffett Indicator (below chart), compares the total value of the stock market to the overall economy.
Right now, it is at a record 211 per cent, which suggests stocks are more expensive than ever. In past cases, when this indicator was this high - such as in 2000 before the tech bubble burst - markets performed poorly for over a decade.
Even legendary investor Warren Buffett is playing it safe, holding a record $321 billion in cash instead of buying stocks.

The ‘Buyer Beware’ chart: A warning for investors
The Buyer Beware chart (pictured below) is a simple way to measure whether the stock market is overpriced.
It combines several key numbers that investors use to judge if stocks are expensive, including:
P/E Ratios: Measures how much investors are paying for company profits.
CAPE (Shiller P/E): A longer-term version of the P/E ratio that smooths out short-term ups and downs.
Price-to-Book (P/B) Ratio: Compares a company’s stock price to its assets.
EV/EBITDA: A measure of a company’s overall value compared to its earnings.
Q Ratio: Compares the market value of companies to the cost of replacing their assets.
Market Cap to GDP: Measures the total value of the stock market compared to the size of the economy.
When these indicators are all at extreme levels, it suggests stocks are dangerously overvalued.
Historically, this has only happened three times before - 1929, 1966, and 1999.
In all three cases, stock prices struggled for over a decade, meaning investors who bought in at the top saw little or no returns for a very long time.
This is why overvalued markets can turn investments into “dead money”, where prices remain flat or even decline for a long time.
Today, the Buyer Beware chart is flashing the same warning signs, suggesting that investors should be cautious about where they put their money.

A recession signal? The Yield Curve Inversion:
One of the biggest red flags is something called a yield curve inversion (attached chart) - a technical sign that has predicted nearly every past recession.
It happens when short-term interest rates (what banks charge to lend money for a short period) become higher than long-term rates.
This situation usually means investors are expecting a slowdown or recession, and it has happened before both the 2000 and 2008 and 2020 crashes.


What This Means for Investors
Is the stock market going to collapse tomorrow? Unlikely.
These are yearly charts - they don’t predict short-term moves but instead reveal the bigger picture.
And right now, long-term indicators are flashing warning signs of excess.
When markets become overheated, they often lose momentum, making it harder for stocks to push higher.
At this stage, corrections become more likely.
The Buyer Beware chart consolidates multiple valuation models into a single, clear warning, and the data suggests we are now in a danger zone - a pattern that has preceded major downturns in the past.
What’s the Smart Move?
Rather than chasing overvalued assets, savvy investors are hunting for undervalued opportunities or waiting for better entry points when prices pull back.
But does this mean you should sit on the sidelines in cash? Not necessarily.
Have you ever successfully timed a major market top?
Do you need to squeeze every last drop of profit out of this rally?
If you answered yes, then take your shot.
But history has shown that when markets reach the excess phase, the best traders and investors position themselves early instead of chasing momentum.
Capital doesn’t disappear - it rotates from overheated assets into undervalued ones.
The key is identifying where that money is flowing next.
Some of the best long-term opportunities come from spotting value before the crowd does. Stay tuned next week for insights on where history suggests the best plays might be in today’s uncertain market.
DISCLAIMER: Information and opinions provided in this column are general in nature and have been prepared for educational purposes only. Always seek personal financial advice tailored to your specific needs before making financial and investment decisions.

How to retire with $1m: Simple strategy revealed
