
Cash is king as real estate spend crashes
Spending on real estate has crashed over the last year, as cash home buys make up a growing number of property sales.

Property
Don't miss out on the headlines from Property. Followed categories will be added to My News.
Over $181 billion was spent on residential property in NSW during the recent financial year, which was 24 per cent down on the prior year’s purchase tally.
But a surprising, and rising, number of buyers have been snapping up property with just cash.
Some 26 per cent of NSW residential property transactions in the June quarter were mortgage free, according to settlements tallied by the online conveyancing firm PEXA, which noted this sizeable cohort of buyers are less impacted by rising interest rates, having not taken out a loan.
The 26 per cent figure was up from 24 per cent in the prior year’s June quarter.
These cash buyers spent $50bn in 2022 in NSW.
Marsden Park, on Sydney’s outskirts, was the NSW location with the highest number of cash buyers (266) followed by Hamlyn Terrace, with 170 mortgage free buyers over the recent three month period.
Austral, Kellyville, Macquarie Park saw high numbers too.
It appears many of the cash buyers secured vacant residential lots as building blocks accounted for 77 per cent of the cash buyers at Marsden Park.
The June quarter cash sales saw the largest portion of sale settlements in rural towns, such as Finley in the Riverina region at nearly 80 per cent of sales.
PEXA’s tracking of the cash buyers market had previously revealed that NSW regional areas had dominated in 2022, with some 56 per cent of regional sales being cash.
The New England region’s Emmaville topped the state in 2022 with cash for 73 per cent of transactions, with a $150,000 median cash value, followed by Gloucester at 65 per cent and Woombah at 62 per cent.
The top 20 locations in NSW had a $770,000 median cash value.
Based on census data there are around 10 million properties in Australia and of these around six million have mortgages against them.
The fresh insights into the composition of the more recent buyers comes from the digitalisation of property settlements. I’d suggest it potentially could trigger the revision of the long held belief that a third of Australian property owners have no mortgage. It might be heading higher.
Some $122bn worth of residential property was purchased with cash in 2022 across the three eastern states that PEXA tracks. It was $124bn without a mortgage in 2021 and $83bn in 2020.
No surprise the highest transaction value was concentrated in the priciest of urban centres. Broadbeach in Queensland topped the eastern states with $1.33bn spent on cash purchases in 2022.
The blue chip metropolitan postcodes of Mosman and Toorak topped the rankings in Sydney and Melbourne respectively.
Mike Gill, PEXA’s head of research, suggests cash settlements helped price strength in the housing market, while Julie Toth, its chief economist, has noted the data shed light on the disparity between generations in wealth and home ownership.
SIGNS POINTING TO SPIKE IN SYDNEY HOME PRICES
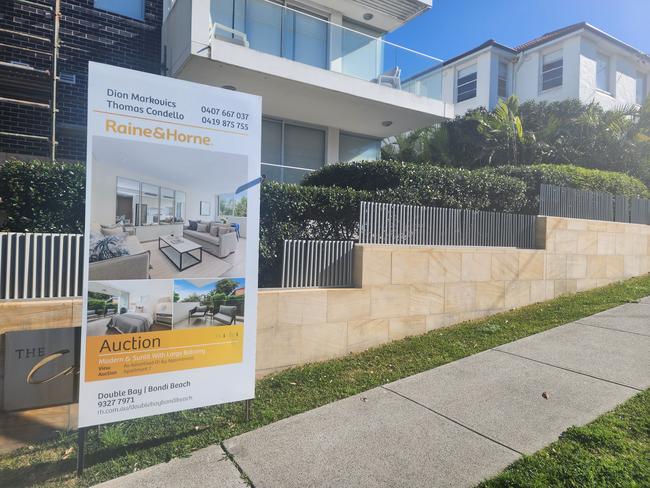
Prospective spring vendors can take their pick – both the auction and private treaty markets are showing signs of likely sales success.
The national capital city preliminary clearance rate has held above 70 per cent for 11 weeks, and in Sydney for 18 weeks, according to CoreLogic, which is a good market for sellers.
PropTrack calculated 520 Sydney homes were put under the hammer last week, with numbers jumping to 675 this week, and then it will be more than 700 as we round out July.
The volumes have predictably been picking up seasonally given the end of the school holidays in NSW.
The recent auction sales strength is attracting some vendors to put their listings up for auction rather than private treaty.
The improvement in auction clearances is “likely supporting a recovery in the popularity of this sales method, and contributing to the rise in auction volumes,” PropTrack economist Anne Flaherty says.
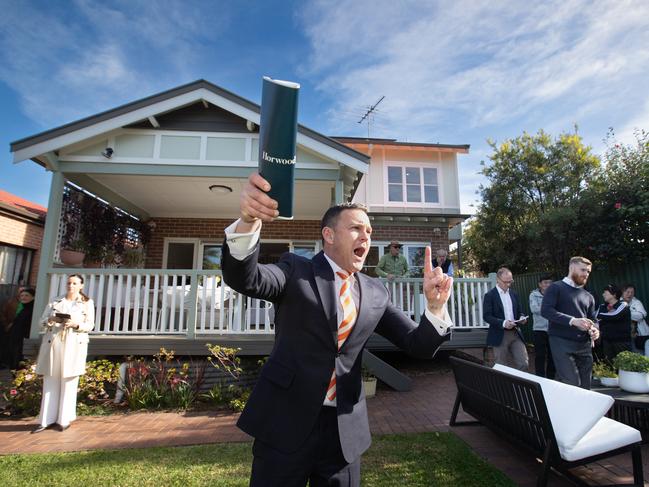
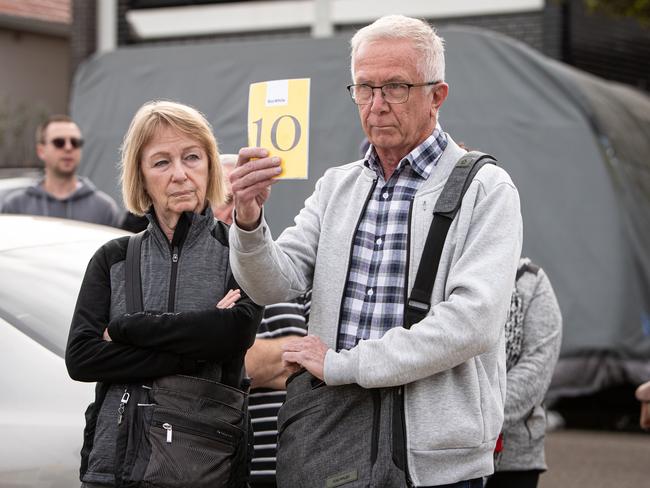
Auctioneer Damien Cooley from Cooley Auctions closely monitors auctions across Sydney.
Last month his 208 listings was down from the 262 in June last year, but the success rate was up from 45 per cent to 70 per cent. It was accompanied by the number of bidders up from three to five, with the average number of bids rising from nine to 17.
Little wonder prices are going higher than reserve.
“We averaged $64,000 over reserve in June,” Cooley noted, up from $45,000 in June last year.
The buyer demand is also evident in the private treaty market, with more Sydney properties recently selling above their asking price than at the beginning of the year.
Some 48 per cent were selling above the asking price in June, up from 10 per cent in January, the largest rise of all the capital cities, PropTrack calculated.
Sydney vendors selling for less than the asking price dipped from 50 per cent in January to 37 per cent in June.
“With this combination of high demand and low listing volumes, the number of properties selling for less than the asking price will drop further, driving up home prices in the near term,” forecasts Karen Dellow, senior data analyst at PropTrack.
The total number of properties listed for sale across Sydney was down around six per cent, at the end of June, relative to the prior decade average.
New Sydney listings were down nine per cent compared to a year earlier, but with considerable variance across Sydney. Fresh Northern Beaches offerings were up 19 per cent, with those in the Sutherland Shire down eight per cent. There was no change in listings at Baulkham Hills and the Hawkesbury.
This variance highlights there is no single market when it comes to supply and demand, so local agents should be sounded out for the best sense of momentum in each market.

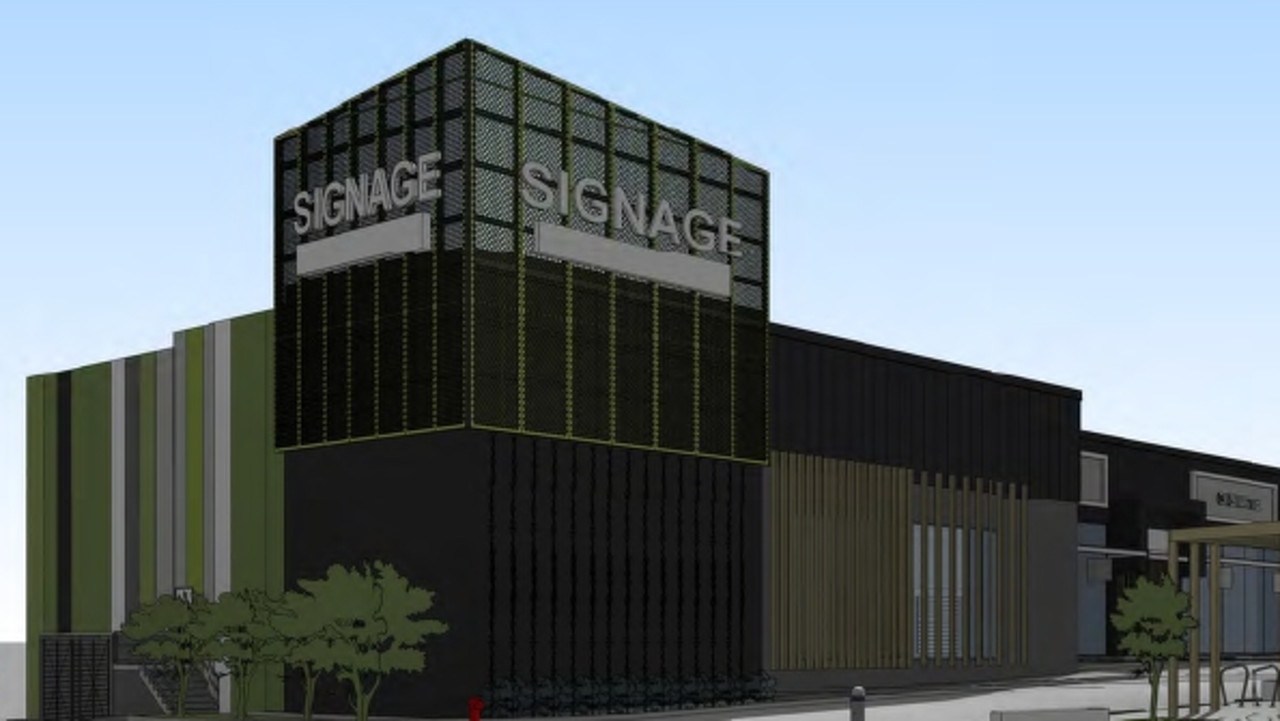
First look: New Coast shopping centre for surprise site
A long-empty site in a surprise location will be transformed into a retail showroom complex under fresh plans lodged with the council. FIND OUT WHERE
Revealed: How much rent you need to pay in every Qld suburb
Rents have increased again in 252 Queensland suburbs, reversing the brief downward trend recorded just three months ago. See how your suburb compares!