
Interest rates: Simple way to compare confusing interest rates offered by lenders
There can be a high price for the loyalty – or laziness – of borrowers to their lender. Luckily there is a simple way to compare home lenders to get the best deal.

Property
Don't miss out on the headlines from Property. Followed categories will be added to My News.
There’s a handy, but little known, online calculator that makes it easier for borrowers to compare confusing interest rate pricing between home lenders on the moneysmart website.
It will certainly come in handy as some 1.1 million plus borrowers see their first of many rate rises from the Reserve Bank of Australia in coming months. Additionally the other batch of borrowers who’ll find it handy will be those who’ll get a nasty surprise when they come out of their fixed loans into the variable home loan rate market.
The online calculator was a recommendation of the Productivity Commission to allow for the easier comparison of home loan interest rates and more transparency to the mortgage market.
Following the recommendation, and approval from the Council of Financial Regulators, ASIC came up with its revised mortgage calculator on Moneysmart.gov.au.
It enables users of the calculator to see the average interest rates for new mortgages.
There are several calculators on the website with the updated mortgage calculator having 1.89 million page views in 2020 after its March 2020 launch. Around 46 per cent of its users identified as first home buyers.
“Obviously the next few months will be of interest, and we will be monitoring usage to see if there are trends,” an ASIC spokesperson told News Corp.
It’s going to become an even more important tool as the difference in interest rates being charged by lenders on new loans as against existing home loans has got bigger.
The current cost of staying put is estimated to be around $2200 on an average $574,000 mortgage with recent figures from the Reserve Bank revealing that interest rates on existing home loans are currently 39 basis points higher, on average, than they are on new loans.
It is a high price for the loyalty – or laziness – of borrowers to their lender.
It was in late 2020 when the Australian Competition and Consumer Commission (ACCC) presented its review of home loan pricing to the Treasurer which focused attention on impediments to borrowers seeking to switch to alternative lenders.
Sadly switching loans and lenders is not an easy task.
Especially given there are over 100 home loan lenders in Australia offering a combined total of nearly 4000 different home loan products.
Switching lenders can take many weeks, or sometimes months, to complete after deciding to engage in the home loan market to look for a better option. At every stage in the switching process borrowers face challenges or frictions, moneysmart acknowledges.
Of course it makes sense to also advise your current lender you are planning to switch to a cheaper loan offered by a different lender as we know that banks will often then endeavour to keep your business and reduce the interest rate on your current loan.
The higher your equity in your property, along with having a good credit score, will assist negotiations.
HOME SALE LOSSES A SIGN OF THINGS TO COME
Sydney was the only capital city that saw a higher rate of loss-making property sales as 2021 ended.
The rate of sales making a nominal loss only ticked up 0.1 per cent between the September and December quarters to 4.3 per cent across Sydney.
Through the December quarter, 95.7 per cent of Sydney resales made a nominal gain, up from 93.3 per cent a year earlier. But Sydney is tipped to see a further rise in loss takers – and less profit for the sellers – especially since apartment values started to slip in the March 2022 quarter.
The data shows a big difference between houses and apartments for profitability.
Some 7.1 per cent of apartments sold in Sydney took a loss during the December quarter. It was just 1.3 per cent for sellers of houses.
The median gain in all the Sydney resales was a healthy $536,500.
The highest rate of loss-making resales was in the Parramatta LGA, with the highest count of loss-making resales being apartments around Parramatta and Wentworth Point.
The Parramatta LGA saw 13.3 per cent of all sales being loss takers.
The next big trouble spot was Strathfield at 13.1 per cent, followed by the Ryde LGA at 11.6 per cent.
The CoreLogic Pain and Gain report estimates around 82 per cent of the Parramatta LGA loss-making sales were investor sales.
The median loss at Parramatta was $35,000, Strathfield was $15,000 and Ryde saw a median $54,000 loss.
The March 2022 quarter saw a 0.6 per cent decline in Sydney units, which may start to see a slip in profitmaking resales over the course of the year, said Eliza Owen at CoreLogic.
“However, declines in Sydney property values are coming off extraordinary gains, and the overall rate of profitability in the Sydney market through the December quarter remained above the long run average of 95.5 per cent,” Owen said.
The highest rate of profitmaking resales across Sydney was in the Hunters Hill LGA, where 100 per cent of resales made a nominal gain. The median gain from resales in Hunters Hill however was below the Sydney median at $460,000.
The Sydney profit taking was slightly lower than the national rate of profit making sales which was 96.2 per cent across all Australian houses, but better than the national rate of 88.6 per cent across apartments.
House sellers have historically seen a premium on nominal gains compared to those reselling units.
Through the December 2021 quarter, the median gain from house resales nationally was $375,500, higher than the $180,000 median gain from apartments. Across Australia apartment sellers typically made a median $38,000 loss, compared to $29,000 across houses.
Loss-making unit sales had a median hold period of 7.8 years, compared to 9.5 years across loss-making house sales.
The Pain and Gain report analysed 133,000 national resales in the December 2021 quarter, which marked six consecutive quarters of increases in the rate of profitability from the September quarter of 2020, when Australia’s housing market began its extraordinary uplift in value.
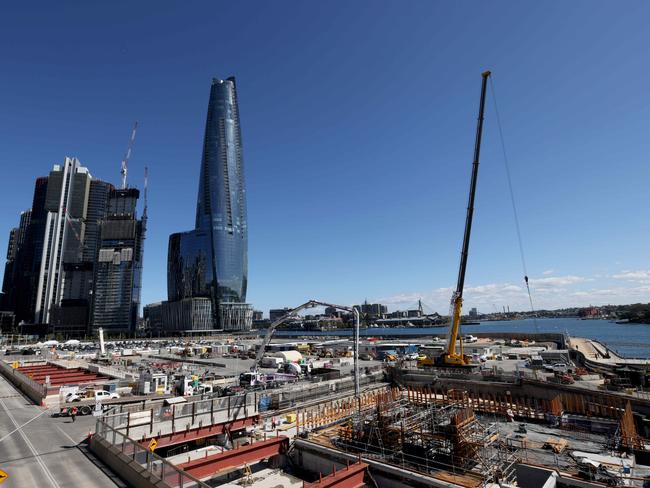
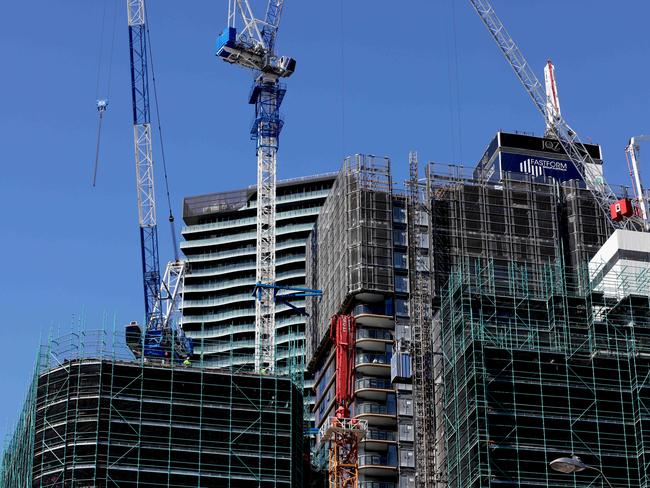
SYDNEY CRANE RECORD A GOOD, YET SOBERING SIGN
There’s been a spurt in the number of apartment construction cranes lining the Sydney skyline.
Shrugging off the Covid-19 pandemic impacts, Sydney saw a jump of 41 residential cranes to 242, in the three months to March 31, the latest RLB Crane Index shows.
The 242 tally sits just below Sydney’s record 282 in early 2017.
The figure does not depict the number of sites as there’s often more than one onsite, i.e. there are four at One Sydney Harbour, Barangaroo.
Sydney’s north has the most cranes with 74. Residential cranes increased by seven to 28 across Sydney’s east. Residential cranes across the South are in 24 suburbs. There are 48 residential cranes in Sydney’s west.
Sydney’s overall tally is 348 cranes – just under half of all cranes across the country – beating a record for the Harbour City which previously stood at 341 in late 2017.
The boost in overall numbers also comes from increases in Sydney’s commercial, hotel, civic and retail sectors.
Hopefully the industry has a better framework now to ensure these construction projects are undertaken safely for its workers. And that the completed projects are built soundly for the buyers.
After the Opal Tower cracking on Christmas Eve 2018, and Mascot Tower subsidence in June 2019, the NSW Government set out to restore public confidence in the multistorey apartment market by lifting standards and increasing accountability.
The industry watchdog David Chandler, who was appointed NSW Building Commissioner in September 2019, regularly calls out shoddy work by developers since the commencement of the Residential Apartment Buildings (Compliance and Enforcement Powers) Act in NSW in September 2020.
The act provides new powers to intervene in projects which may have serious defects in their building. These powers include delaying the issue of an occupation certificate and seeking rectification before buyers settle on the off the plan apartments.
There’s also a ratings tool, known as iCIRT, that pulls together key data endorsed by NSW Fair Trading to demonstrate the character, capability and capital of apartment developers to buyers.
The ratings give a clearer picture of a developer’s trustworthiness and the predictability of whether they are likely to have the capacity to fix issues after settlement.

Last week, the NSW Minister for Fair Trading, Eleni Petinos introduced the Scaffolding Industry Safety Standard, an important guide to prevent scaffolding-related injuries and deaths on worksites.
The Safety Standard follows the tragic death of Christopher Cassaniti in 2019 when nine storey scaffolding collapsed at Greenland’s Lachlan’s Line Macquarie Park development, where the scaffold was being used to store bricks after the hoist was in the process of being removed.
Christopher Cassaniti was fatally injured just after his 18th birthday while another worker, Kahled Wehbe suffered permanent life-changing injuries.
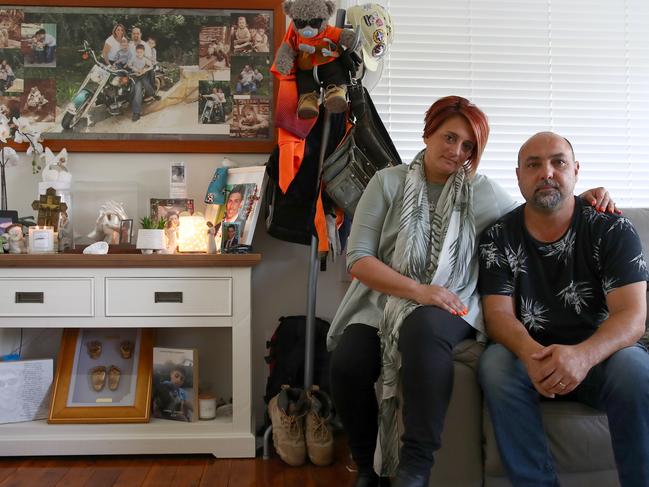
The mother of the teenage apprentice, Patrizia Cassaniti has been devoted to improving workplace safety, becoming the driving force behind the new guide and the SafeWork NSW ‘Speak Up, Save Lives’ app, which encourages the anonymous reporting of workplace safety risks.


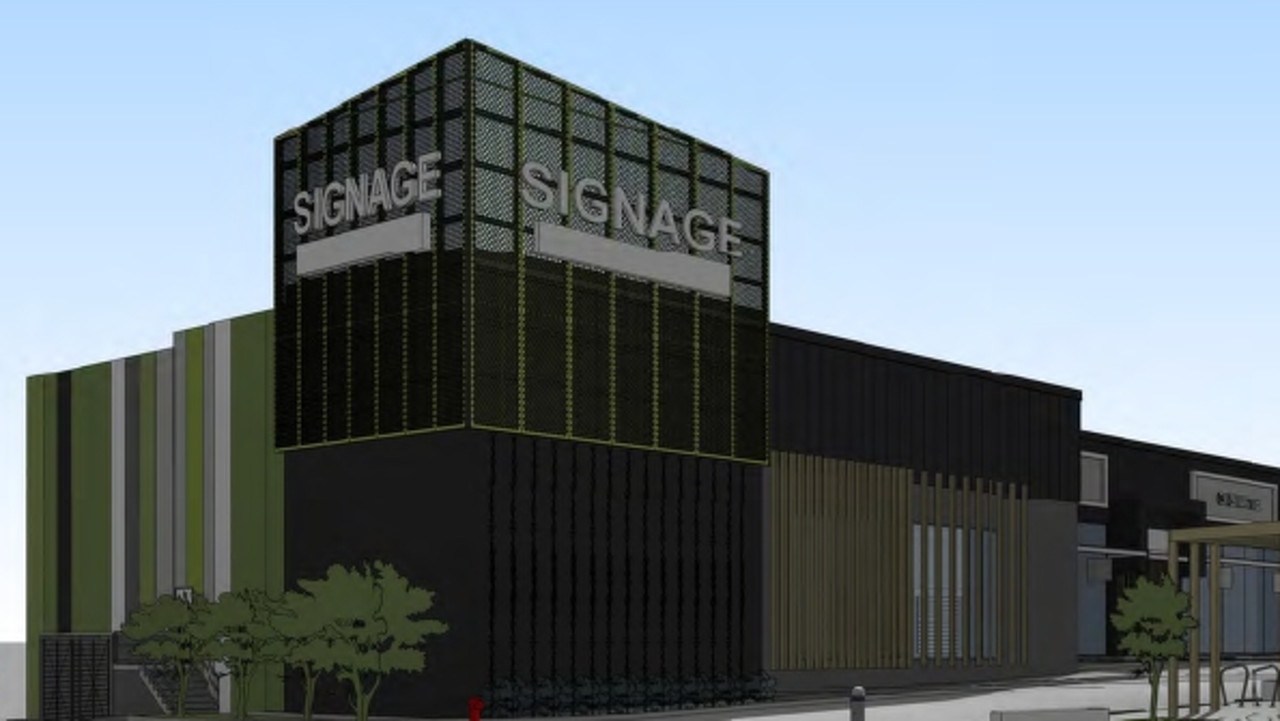
First look: New Coast shopping centre for surprise site
A long-empty site in a surprise location will be transformed into a retail showroom complex under fresh plans lodged with the council. FIND OUT WHERE
Revealed: How much rent you need to pay in every Qld suburb
Rents have increased again in 252 Queensland suburbs, reversing the brief downward trend recorded just three months ago. See how your suburb compares!