Census data reveals divorce rate hotpots of Sydney
An affluent city region has emerged as the divorce capital of Sydney with relationship counsellors attributing the high rates to the impacts of Covid and households feeling the financial pinch.
North Shore
Don't miss out on the headlines from North Shore. Followed categories will be added to My News.
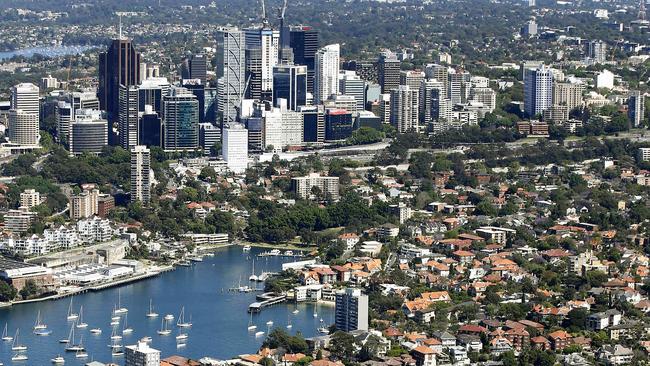
A north shore council area has emerged as the divorce capital of Sydney – but relationship counsellors say it doesn’t mean residents in the region are any worse at holding their marriages together.
An analysis of newly released Census data has revealed 8.8 per cent of residents in North Sydney were registered as divorced on Census night last year, with the council area home to a population of 6074 divorcees.
The figure is the highest rate for any local government area in Sydney – ahead of Mosman (7.7 per cent), Fairfield (7.4 per cent), Woollahra (7.4 per cent), the City of Sydney (7 per cent) and the Inner West (7 per cent).
North Sydney’s rate more than doubles some other local government areas including The Hills Shire which had Sydney’s lowest divorce rate at 4.2 per cent and Ku-ring-gai at 4.4 per cent.
State-wide, the Census figures show 596,516 residents registered as divorced last year – up from 512,298 from the previous Census in 2016.

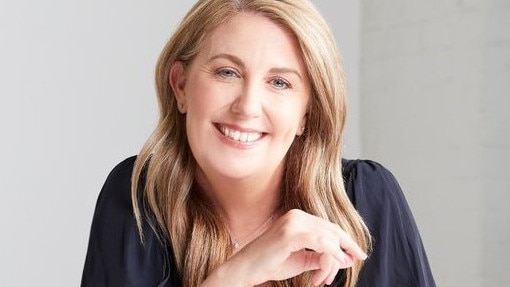
While specific research to explain the statistics has not been done, Kirribilli-based divorce lawyer Bron O’Loan said North Sydney’s divorce rate could reflect two years of Covid-19 pressures along with households coming under increasing financial stress.
“In the last two years we’ve seen a big uptick in cases coming through our firm which has been stemming from long lockdowns with couples spending more time together at home and re-evaluating their marriages,” she said.
“In North Sydney couples are also coming under a lot of economic pressure where they may have been pushing themselves financially to retain homes and possibly overextended when times were good and unfortunately that’s now created a perfect storm.
“Sadly the other thing that’s been very prevalent on the north shore is a rise in family and domestic violence – and particularly during the last six months – and unfortunately it’s primarily affecting women.
“We’re also seeing what I call the ‘grey divorce’ where increasing numbers of older people are having marriages dissolved. In the past the average divorce was in the age range of 40-50 and that’s moving up the over-60s age group. In the past, people may have carried out but now they’re saying life’s too short.
“That’s also a flow-on effect from Covid with people re-evaluating their lives and more willing to focus on their own wellbeing. You only have to look at the pilates studios on the north shore to see that – they’re heaving.
“That’s giving people the strength to get out of toxic relationships as well.”
North shore relationship counsellor Jean Gamble said North Sydney’s ranking may reflect the socio-economic factors of the local government area.
“There are a lot of couples regardless of where they live that would like to separate but can’t afford to because they have to find separate accommodation and may have to factor in children so they end up putting up with the marriage in an arrangement where they’re living together but leading separate lives,” she said.
“In areas like the lower north shore which have a higher socio-economic profile, couples may have increased capacity to split. It doesn’t necessarily mean marriages in North Sydney are worse than anywhere else but it does suggest couples have the resources to enable a separation.”
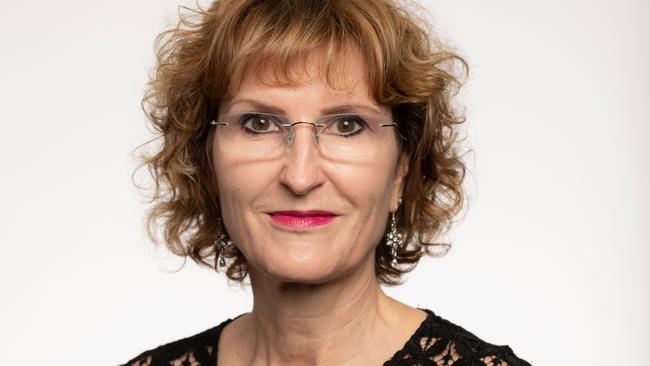
Relationships Australia chief executive Elizabeth Shaw said there may be unique factors why two very different local government areas – North Sydney and Fairfield – ranked at the top of the divorce rate figures.
“It probably portrays two very different socio-economic groups and during Covid we certainly saw a great deal of unemployment uncertainty in western Sydney and they had the other factor of long lockdowns and that would have been a particular stress factor,” she said.
“Areas with a high migrant population may also have had the additional pressure of being cut off by international travel from their key support group such as extended family.
“In North Sydney it could be more to do with the impact of couples who had been leading busy corporate lives were suddenly thrown together during lockdown and coming face-to-face with long-term or underlying problems.
“When the chips are down that’s when you tend to measure up your relationships.”
National Children’s Commissioner Anne Hollonds said the housing mix in areas such as North Sydney, Woollahra, the Inner West and the City of Sydney may also be contributing factors reflected in the Census statistics.
“Places like North Sydney and the inner west are places people would go after they go after they’re divorced and have moved out of the family house and are looking to live in an apartment or a smaller house. It’s not to say people in those areas are more prone to divorce, but rather it’s harder to stay in a family home in the suburbs,” she said.
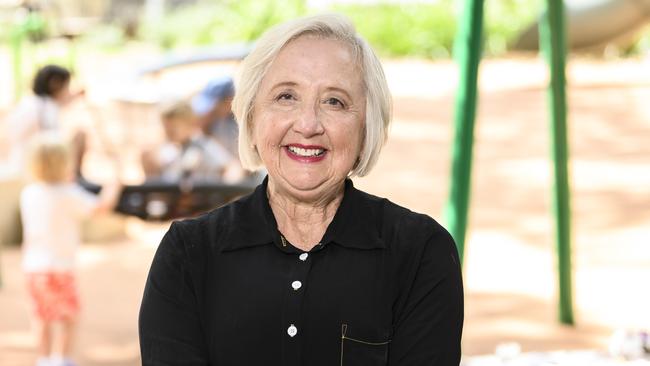
“Over the past two years there’s also been a lot of discussion about people reviewing their properties in life and ‘the great resignation’ from jobs and it would be remarkable if we didn't see people make decisions about their relationship as well.
“The main impact we need to be worried about is where a divorce is an adversarial one and disputes go on for years because we’ve known for a long time the impacts that has on children.”
The Census figures show the 8.6 per cent divorce rate of people aged over 15 in NSW is 0.2 per cent higher in NSW than the Australian average of 8.4 per cent.
SYDNEY’S DIVORCE RATE HOTPOTS
1) North Sydney – 8.8 per cent
2) Mosman – 7.7 per cent
3) Fairfield – 7.4 per cent
4) Woollahra – 7.4 per cent
5) City of Sydney – 7 per cent
6) Inner West – 7 per cent
7) Northern Beaches – 6.9 per cent
8) Canterbury-Bankstown – 6.7 per cent
9) Penrith – 6.7 per cent
10) Bayside – 6.6 per cent
11) Canada Bay – 6.6 per cent
12) Sutherland Shire – 6.6 per cent
13) Hunters Hill – 6.5 per cent
14) Waverley – 6.4 per cent
15) Randwick – 6.3 per cent.


