
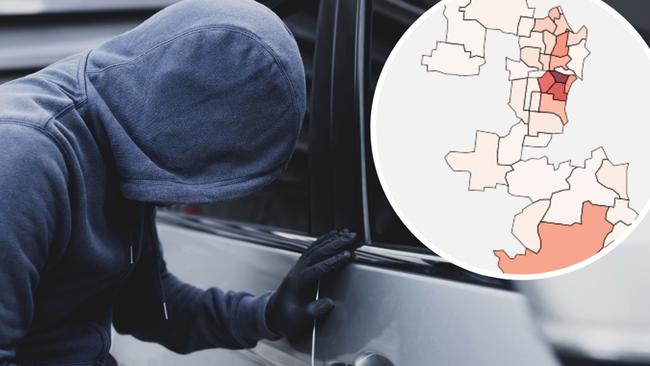
Mackay’s worst suburbs for car theft mapped
An analysis of car theft data for Mackay suburbs has shown the most at-risk. Use our interactive map to see how your street compares.
Police & Courts
Don't miss out on the headlines from Police & Courts. Followed categories will be added to My News.
Crime data in Mackay has been tracked and compared to reveal which suburbs have caught the attention of car thieves.
Car theft is a hot topic for Mackay region residents with many people expressing frustration at the number of stolen cars and offering differing opinions on how to tackle the issue.
Using new data from the National Motor Vehicle Theft Reduction Council, we have been able to track and compare the number of car thefts throughout the region for the past five years.
Note, the data for suburbs with no thefts in the 2020-21 financial year was not available.
Here are the most risky suburbs for vehicle theft ranked on how many vehicles were stolen in the past financial year.
RANKED: Best to Worst suburbs for Mackay car theft
37. Cremorne
Total number of vehicles stolen in 2020-21: 1
Change from the previous financial year: 1
A total of one car was stolen from the suburb which according to CarSafe’s data is the first time a vehicle had been stolen from Cremorne in five years.
The vehicle was a 1990s make, valued less than $5000 and was not stolen from a residence.
36. Balnagowan
Total number of vehicles stolen in 2020-21: 1
Change from the previous financial year: -2
The number of vehicles stolen in Balnagowan was two fewer than the previous year with a total of five vehicle thefts in the past five years.
In the 2019-20 financial year the three vehicles stolen were all motorbikes.
The single vehicle stolen from Balnagowan in the 2020-21 financial year was a car valued less than $5000 and made in the 2000s, taken from a residence.
35. Rosella
Total number of vehicles stolen in 2020-21: 1
Change from the previous financial year: 0
One vehicle was reported stolen from Rosella in the 2020-21 financial year mirroring that of 2019-20 records.
The vehicle stolen was a car valued between $5000 and $10,000 and was manufactured in the 1990s.
The only other previous vehicle thefts in the suburb were three motorcycles stolen in 2018-19, bringing the total number of vehicle thefts in the past five years to four.
34. Alligator Creek
Total number of vehicles stolen in 2020-21: 1
Change from the previous financial year: 0
The most popular type of vehicle for thieves in Alligator Creek was a car valued between $5000 – $10,000 and made in the 2010s and was stolen from a residence.
In the past five years, the worst year for car theft was between 2017 -2018 where a total of five vehicles were stolen.
The total number of vehicles stolen in five years was eight.
33. Sandiford
Total number of vehicles stolen in 2020-21: 1
Change from the previous financial year: -1
The one vehicle stolen from Sandiford in 2020-21 was a motorbike manufactured in the 2010s and was stolen from a private property.
This was lower than the previous financial year which had recorded one motorbike and one car stolen.
The total number of vehicle thefts for the suburb for the past five years was four.
32. The Leap
Total number of vehicles stolen in 2020-21: 1
Change from the previous financial year: -2
Data has shown a steady decline in vehicle thefts for The Leap in the past three years with four recorded in 2018/19, three in 2019/20 and one for the past financial year with a total of 10 for the past five years.
The single vehicle stolen was a car valued less than $5000 and manufactured in the 2000s.
It was stolen from a private residence.
31. Balberra
Total number of vehicles stolen in 2020-21: 1
Change from the previous financial year: -2
The number of vehicles stolen in Balberra was two fewer than the previous year with a total of eight cars stolen from the suburb in the past five years.
The only stolen car from Balberra in the 2020-21 financial year was a 2000s model valued between $5000 – $10,000 and was taken from a residence.
30. Erakala
Total number of vehicles stolen in 2020-21: 1
Change from the previous financial year: -4
Vehicle thefts in Erakala took a considerable drop since the five recorded in the 2019-20 financial year.
A total of 10 vehicle thefts were reported in the past five years for the suburb.
The single car stolen from Erakala was valued more than $30,000 and was taken from a residence.
29. Dolphin Heads
Total number of vehicles stolen in 2020-21: 1
Change from the previous financial year: -1
Vehicle thefts in Dolphin Heads have decreases in the past three years with one fewer than the previous financial year and three fewer than in 2018-19.
The total number of car thefts for the suburb in the past five years was nine.
The single vehicle stolen from Dolphin Heads in the 2020-21 financial year was a 2000s model car valued between $5000 and $10,000.
28. Mackay Harbour
Total number of vehicles stolen in 2020-21: 1
Change from the previous financial year: -7
Vehicle thefts took a drastic drop in Mackay Harbour from the eight vehicles stolen in the 2019-20 to just one recorded in 2020-21
The single car stolen was taken from a non-residence and was valued between $5000 and $10,000.
The suburb clocked in a total of 16 car thefts in the past five years.
27. Nindaroo
Total number of vehicles stolen in 2020-21: 2
Change from the previous financial year: 2
There was a jump in cars stolen for Nindaroo as there were no vehicles thefts recorded in 2019-20.
One car was reported stolen in 2016-17, zero in 2017-19 and one in 2018-19 resulting in a total of four vehicles stolen from the suburb in the past five years.
The two vehicles stolen from Nindaroo were both made in the 2010s and were taken from private dwellings.
26. Grasstree Beach
Total number of vehicles stolen in 2020-21: 2
Change from the previous financial year: 1
One car and one motorbike were stolen from Grasstree Beach in the 2020-21 financial year. doubling from the single vehicle stolen in 2019-20.
One of the vehicles was taken from a private dwelling and bother were valued between $10,000 and $20,000.
A total of eight vehicles were stolen from Grasstree Beach in the past five years.
25. Habana
Total number of vehicles stolen in 2020-21: 2
Change from the previous financial year: 1
The number of stolen vehicles in Habana has doubled since the previous financial year but is still well below the spike the suburb endured in 2018-19 when five vehicles were stolen.
Of the vehicles stolen in 2020-21, both were manufactured in the 2010s with one valued between $10,000 and $20,000 and the other between $20,000 and $30,000.
The total number of vehicles stolen from Habana in the past five years was 10.
24. Sarina Beach
Total number of vehicles stolen in 2020-21: 2
Change from the previous financial year: -1
Figures show Sarina Beach has had a general decrease in vehicle thefts from the five stolen in 2016-17.
Three vehicles were stolen in 2019-20, one in 2018-19, and four in 2017-18 with a total of 15 vehicles stolen from the suburb in the past five years.
Of the two vehicles stolen in 2020-21, one was taken from a private dwelling and both were valued between $10,000 and $20,000.
23. Racecourse
Total number of vehicles stolen in 2020-21: 2
Change from the previous financial year: 1
Neither of the two vehicles stolen from Racecourse were taken from a private dwelling in the 2020-21 financial year.
Data shows both vehicles were valued between $20,000 and $30,000, with one specified as an “other vehicle” and one as a car.
The total number of vehicles stolen from the area in the past five years was 16.
22. Homebush
Total number of vehicles stolen in 2020-21: 3
Change from the previous financial year: 3
There has been a spike in vehicle thefts in Homebush for 2020-21 after zero reported car thefts between 2018-19 and 2019-20.
The last previous spike was recorded in 2017-18 when two motorbikes and one other vehicle were stolen in the suburb.
The total number of vehicles stolen from the area in the past five years was six.
For the 2020-21 thefts, all three vehicles were valued between $10,000 and $20,000 with two stolen from private dwellings.
21. Munbura
Total number of vehicles stolen in 2020-21: 3
Change from the previous financial year: 3
Munbura residents have experienced a drastic incline in vehicle thefts with the 2020-21 financial year the first time in five years any vehicles had been reported stolen.
The three vehicles stolen were all cars, one manufactured in the 2010s, one in the 2000s and the third unknown.
The total number of stolen vehicles for Munbura for the past five years was three.
20. Richmond
Total number of vehicles stolen in 2020-21: 3
Change from the previous financial year: 0
The number of vehicles stolen from Richmond in the past two financial years remained the same but dropped by two from the five recorded in 2018-19.
The three stolen in 2020-21 were all cars and taken from private dwellings.
Two of the cars were valued at more than $30,000.
The total number of vehicles stolen from Richmond in the past five years was 17.
19. Te Kowai
Total number of vehicles stolen in 2020-21: 4
Change from the previous financial year: 2
Vehicle thefts in Te Kowai doubled from 2019-20 to 2020-21 with three motorbikes and one car reported stolen.
The vehicles were all estimated to be worth between $10,000 and $20,000 and were stolen from private dwellings.
The total number of vehicle thefts for the suburb in the past five financial years was 12.
18. Hay Point
Total number of vehicles stolen in 2020-21: 4
Change from the previous financial year: 2
Hay Point has experienced a rise in car thefts since the 2019-20 financial year but it is still substantially fewer than the spike of nine stolen cars in 2018-19.
Of the vehicles stolen in 2020-21, two were valued less than $5000 and two were manufactured in the 2000s.
Three-quarters were stolen from private dwellings.
The total number of vehicle thefts for the suburb in the past five financial years was 19.
17. Ooralea
Total number of vehicles stolen in 2020-21: 4
Change from the previous financial year: -6
Ooralea residents have experiences a halving in the number of vehicle thefts since 2019-20 with four cars stolen in the past financial year.
The total of vehicles stolen from Ooralea in the past five years was 35, with eight being stolen in both 2016-17 and 2018-19, and five in 2018-19.
Of the four stolen in 2020-21, half were worth between $10,000 and $20,000 and three-quarters were manufactured in the 2010s.
Three of the four cars were stolen from private dwellings.
The total number of vehicle thefts in the past five years was 35.
16. Bakers Creek
Total number of vehicles stolen in 2020-21: 5
Change from the previous financial year: 0
The number of vehicles stolen from Bakers Creek remained the same from the previous year, however had increased by two from the years 2016-18.
One of the five vehicles stolen was listed as something other than a car or motorbike, and 60 per cent were stolen from a residence.
About 50 per cent of the vehicles stolen were valued less than $5000, and 25 per cent were valued more than $30,000.
The total number of vehicle thefts for the suburb in the past five financial years was 18.
15. Glenella
Total number of vehicles stolen in 2020-21: 7
Change from the previous financial year: 0
Vehicle thefts in Glenella plateaued after a considerable between 2017 and 2019 where a total of 30 vehicles were stolen.
The number of cars stolen in the 2020-21 financial year was the same as the previous financial year.
About 86 per cent of the stolen vehicles from the most recent financial year were taken from a private dwelling with a three-way tie in most popular value for those less than $5000, $10,000 to $20,000 and $20,000 to $30,000.
The total number of vehicle thefts for the suburb in the past five financial years was 51.
14. Slade Point
Total number of vehicles stolen in 2020-21: 9
Change from previous financial year: -6
The total number of vehicles stolen in the 2020-21 financial was the lowest it has been in five years.
There were 15 reported vehicle thefts in 2019-20, 11 in 2018-19, 15 in 2017-18 and nine in 2016-17.
Nearly one in 10 of the vehicles stolen in 2020-21 were from a private dwelling with 44 per cent valued between $10,000 and $20,000.
The total number of vehicle thefts in the past five years was 49.
13. Beaconsfield
Total number of vehicles stolen in 2020-21: 9
Change from previous financial year: -2
The total number of vehicles stolen from Beaconsfield were taken from residential addresses and included one motorbike and one “other vehicle”.
About 57 per cent of the cars stolen from the suburb were valued between $5000 – $10,000 and two thirds were manufactured in the 2010s.
Nine out of 10 vehicles were stolen from a residence, and one in seven were valued $30,000 or more.
The worst year for vehicle thefts for the Beaconsfield was 2017-18 with 14 cars stolen and a total of 51 vehicles were stolen from the suburb in the past five years.
12. Mount Pleasant
Total number of vehicles stolen in 2020-21: 10
Change from previous financial year: -7
Mount Pleasant residents had a similar number of car thefts since the previous financial year but there was a substantial drop in reported motorbike thefts.
In 2019-20 a total of 17 vehicles were stolen, comprising of 11 cars, five motorbikes and one other vehicle.
The 2020-21 figures showed 11 cars stolen, 70 per cent of which were taken from private dwellings.
About 40 per cent were valued less than $5000.
The total number of vehicle thefts in the past five years was 65.
11. Blacks Beach
Total number of vehicles stolen in 2020-21: 11
Change from previous financial year: 6
The number of vehicles stolen from Blacks Beach more than doubled since the previous financial year.
The most popular makes of vehicles were manufactured between 2000 and 2019 with a three-way tie of vehicles valued $5000 and less, $10,000 to $20,000 and $30,000 or more.
Nine out of 10 vehicles were stolen from a residence, which included one motorbike.
In the past five years, a total of 41 vehicles were stolen from the suburb.
10. Rural View
Total number of vehicles stolen in 2020-21: 12
Change from previous financial year: -4
Overall vehicle thefts in Rural View declined since 2019-20 but 2020-21 was also the first time in five years any “other” vehicles and a motorbike had been stolen from the suburb.
The majority of vehicles stolen in 2020-21 were valued between $10,000 and $20,000 and were manufactured in the 2010s.
About 58 per cent of the vehicles were stolen from private dwellings.
The total number for vehicle thefts in the suburb for the past five years was 56.
9. Eimeo
Total number of vehicles stolen in 2020-21: 15
Change from previous financial year: 13
A total of 30 vehicles were stolen from Eimeo with half of those taken in the 2020-21 financial year.
The number of stolen vehicles jumped considerably from only two recorded in 2019-20 to 15 in 2020-21.
Included in the 15 vehicles stolen in the 2020-21 were 11 cars, three motorbikes and one “other vehicle”.
Nearly half of the vehicles stolen from the suburb were valued between $5000 and $10,000 with one third estimated to be $20,000 to $30,000.
8. Paget
Total number of vehicles stolen in 2020-21: 16
Change from previous financial year: -5
Despite a decrease in private car thefts, Paget businesses experienced an increase of four “other vehicles” thefts since 2019-20.
Data shows a rollercoaster of results for the suburb in the past five years with eight vehicles stolen in 2016-17, 20 in 2017-18, 14 in 2018-19 and 21 in 2019-20.
From the past financial year only 6 per cent were stolen from private dwellings and 40 per cent were valued below $5000.
The majority of vehicles were manufactured in the 2010s.
The total number for vehicle thefts in Paget for the past five years was 79.
7. North Mackay
Total number of vehicles stolen in 2020-21: 17
Change from the previous financial year: -17
The number of stolen vehicles in North Mackay has halved since 2019-20 which clocked in with 33 stolen cars and one stolen motorbike.
The data from the 2020-21 results show 16 cars and one motorbike stolen from the suburb with 31 per cent being valued between $10,000 and $20,000.
Almost two-thirds were made in the 2010s and 65 per cent were stolen from private dwellings.
There has been a total of 114 vehicles stolen from North Mackay in the past five years.
6. Sarina
Total number of vehicles stolen in 2020-21: 21
Change from the previous financial year: 6
Figures for Sarina have been consistently high for the past four years, with 15 vehicles stolen in 2019-20, 18 in 2018-19 and 21 in 2017-18.
For the 2020-21 financial year, the vehicle thefts comprised 18 cars and three motorbikes.
About one-third were valued between $10,000 to $20,000 and about half were stolen from a private dwelling.
A total of 87 vehicles were stolen from Sarina in the past five years.
5. East Mackay
Total number of vehicles stolen in 2020-21: 22
Change from the previous financial year: 1
East Mackay has had a consistent increase in vehicle thefts since 2016 with a total of 75 stolen in the past five years.
In the 2020-21 financial year, 77 per cent of vehicles were take from a residence with 60 per cent and were manufactured in the 2010s.
Most of the vehicles were valued at $5000 to $10,000 with nearly 20 per cent being $30,000 or more.
One of the vehicles was reported to be something other than a motorbike or car and 77 per cent were stolen from a residence.
4. Andergrove
Total number of vehicles stolen in 2020-21: 24
Change from the previous financial year: -1
Vehicles valued less than $10,000 were the most popular to be targeted, coming in at 50.6 per cent of the total cars stolen from the suburb.
But higher end cars were also not safe, with 4.5 per cent of the vehicles stolen valued at $30,000 or more, and two motorbikes also among the mix.
About 67 per cent of the vehicles stolen were from residences.
The total number of vehicles stolen in the past five years was 118.
3. West Mackay
Total number of vehicles stolen in 2020-21: 32
Change from the previous financial year: -7
The number of vehicles stolen from West Mackay has reduced from 2019-20 to 2020-21 but was still more than those recorded between 2016-2019.
There were nine vehicles stolen in 2016-17, 11 in 2017-18 and 12 in 2018-19.
For the past five years, a total of 135 vehicles were stolen from the suburb.
In 2020-21, half the number of stolen vehicles were taken from a private residence with 34.5 per cent valued less than $5000.
2. South Mackay
Total number of vehicles stolen in 2020-21: 36
Change from the previous financial year: 3
South Mackay is one of the most popular Mackay suburbs for thieves with 150 vehicles stolen in the past five years.
The suburb experienced a drop in vehicle thefts in 2018-19 recording 16, before jumping up to 33 in 2019-20 and 36 in 2020-21.
About 60 per cent of the thefts were from private dwellings in the past financial year, with one-third of the vehicles valued $5000 and less.
1. Mackay City
Total number of vehicles stolen in 2020-21: 49
Change from the previous financial year: -19
The city of Mackay experienced a reduction in vehicle thefts since 2019-21 when 68 vehicles were stolen, a jump from the 43 stolen in 2018-19.
A total of 225 vehicles had been stolen since in the past five years.
Of the 49 vehicles stolen in the 2020-21 financial year, 40 were cars and nine were motorbikes.
More than one-third were valued at less than $5000, with 15 per cent clocking in at more than $30,000.


Search for man, 92, missing in Qld outback for six days
A search and rescue mission has been launched with police, SES and community members scouring the outback for any sign of a man who has been missing for six days.

‘He was scared of the night’: Truckie allegedly sexually abused two boys
The man, who was a friend of the family, had been invited to stay at their home in Mackay when it is alleged he indecently dealt with two young boys over five months. He has denied the allegations.