
ASX Trader: Global market on brink? This asset often soars in a downturn
Alarmed investors worried about years of ‘dead money’ if global markets collapse can look to history for answers – and one asset often thrives in a downturn, writes ASX Trader.

QLD Business
Don't miss out on the headlines from QLD Business. Followed categories will be added to My News.
As global financial markets teeter on the brink of a possible massive collapse, alarmed investors are likely wondering how to protect their portfolio and where to put their money.
History holds the answers.
Stock markets around the world fell sharply on Tuesday after US President Donald Trump refused to rule out a recession amid an escalating trade war.
Last week, we discussed how the American stock market is currently priced at extreme valuations - levels only seen before past crashes in 1929, 1966, and 2000.
Each of these instances led to a prolonged period of poor returns for stocks, where equities became what was known as ‘dead money’ for over a decade.
While this might sound alarming to investors heavily allocated in stocks, history teaches us that opportunities still exist in such environments.
The key is to look at what performed well during these previous cycles of extreme market overvaluation.
The answer lies in the past: Where to invest when equities are overpriced
In each of these periods - post-1929, post-1966, and post-2000 - one asset class consistently outperformed: precious metals.
Gold and silver thrived in these environments, delivering strong returns while equities stagnated.
The question is, why?
The answer comes down to economic cycles and monetary policy.
Historically, when equity valuations become stretched to unsustainable levels, two things tend to follow: economic slowdowns and shifts in monetary policy to accommodate financial imbalances.
These conditions tend to fuel inflation or, at the very least, monetary debasement, making certain assets far more attractive than stocks.
The Gold-to-Dow ratio: a historic indicator
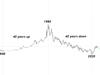
One of the clearest signals of these shifts is the Gold-to-Dow ratio (below chart), which measures how many ounces of gold it takes to buy one unit of the Dow Jones Industrial Average (a major stock market index).
Historically, when equities have been extremely expensive - like in 1929, 1966, and 2000 - the Gold-to-Dow ratio has been at its lowest, meaning gold was relatively cheap in comparison.
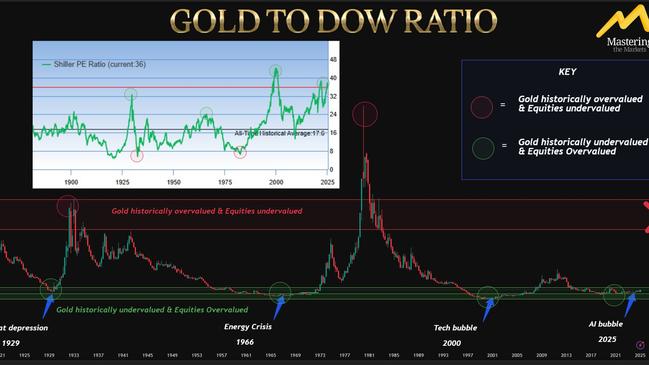
Another key measure, the Shiller P/E ratio, helps show when stocks are overpriced.
Interestingly, it often lines up with low points in the Gold-to-Dow ratio (marked by the green and red dots on the chart).
This suggests that when stocks are expensive, gold is usually undervalued.
Each time this has happened, the market has reversed, and gold has surged ahead.
For example, in the early 1980s, the Gold-to-Dow ratio hit 1:1, meaning one ounce of gold could buy the entire Dow index.
Compare that to 1999, when it took over 40 ounces of gold to do the same.
This shows that when equities are historically expensive, precious metals tend to be historically cheap.
Coincidence? I think not.

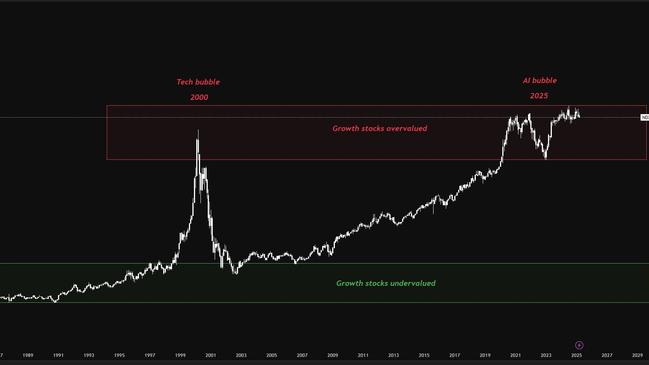
The Nasdaq-to-S&P 500 Ratio: Growth at a cycle peak?
Another key indicator of market cycles is the Nasdaq-to-S&P 500 ratio, which measures the relative performance of technology-heavy Nasdaq stocks compared to the broader S&P 500 index.
Historically, when this ratio reaches extreme levels, it has often signalled that growth stocks - particularly those in the technology sector - are at the peak of their cycle.
Currently, the Nasdaq-to-S&P 500 ratio is at levels not seen since the peak of the dot-com bubble in 2000.
During that period, technology stocks saw extraordinary gains before experiencing a sharp and prolonged decline.
When the ratio reaches historically high levels, it suggests that growth stocks may be overextended, similar to what was observed before past market corrections.
While this does not guarantee an imminent reversal, it highlights the importance of considering broader market cycles and diversification strategies.
If history serves as a guide, markets tend to rotate between growth-driven cycles and value-oriented or inflation-sensitive assets.
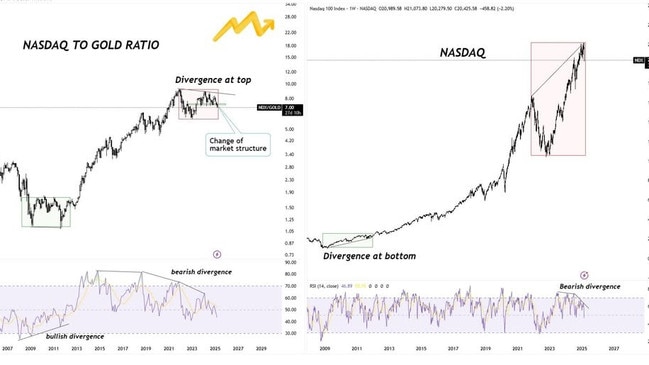
Tech Stocks in Trouble? The NASDAQ to Gold Ratio Sends a Warning
The NASDAQ to Gold Ratio is a key signal for tech stocks, and right now, it’s flashing a warning.
In past market cycles, this ratio has predicted major shifts - like the 2000 Tech Bubble, where a peak signalled a crash, and the 2008 GFC recovery, when a bottom signalled a rebound.
Today, we’re seeing a bearish divergence, meaning tech stocks are losing ground to gold, a classic sign that investors are shifting towards safer assets.
Even more concerning, the ratio has broken key support, just like it did before past downturns.
If history repeats, growth stocks could struggle while gold and defensive investments take the lead.
Keep an eye on this ratio—when it breaks, markets tend to change.
Precious metals as an inflationary hedge
Precious metals, particularly gold and silver, are widely regarded as inflationary hedges.
When excessive money printing, high government debt, and rising costs erode the purchasing power of fiat currencies, investors seek refuge in assets that hold intrinsic value.
This was evident in the 1970s when inflation soared, leading gold prices to surge over 2,000 per cent from $35 per ounce in 1971 to over $800 per ounce by 1980.
Similarly, after the dot-com bubble burst in 2000, gold entered another strong bull market, rising from around $250 per ounce to nearly $1,900 by 2011, fuelled by loose monetary policy, a weak dollar, and rising commodity prices.
Commodities vs stocks
The trend is clear: when equity markets are overvalued, and economic conditions tighten, hard assets (commodities) tend to outperform paper assets (stocks/equities).
In other words, savvy investors will look to buy physical silver, gold and other commodities, rather than growth stocks.
This extends beyond just precious metals to other commodities such as energy and industrial metals, as well as real estate in certain cycles.
These assets benefit from inflationary environments, where tangible value becomes more attractive than overinflated financial instruments.

Looking forward: What to expect next?
With US equities once again at historic extremes, it is essential for investors to consider alternatives.
The macroeconomic backdrop of high government debt, persistent inflationary pressures, and central bank intervention resembles past cycles where equities underperformed and inflationary assets thrived.
While history does not repeat itself exactly, it often rhymes. The last three instances of extreme equity overvaluation led to stagnation in stocks and significant outperformance in precious metals and hard assets. The question for investors now is: will this time be different, or will the past once again provide the answers we seek?
Either way, being prepared for a shift in market leadership could be the key to navigating the next decade successfully.
More Coverage

Ranked: Secret customer benefits of Australia’s best loyalty programs
From free coffees to mega perks, Aussie retailers’ loyalty programs have evolved into sophisticated powerhouses in an $8bn battle to lure customers. The best rewards programs ranked >>

‘Tone deaf’: Aussie brands on tightrope with kiss-cam scandal memes
Aussie and international brands have rushed to piggyback the Coldplay kiss-cam scandal, creating a flood of memes riffing off the viral moment - but can this sort of marketing backfire? Read what the experts say and take our poll