
Adelaide United’s average attendance this season is the worst in the club’s history
Despite changing the pricing structure to ticket prices and a change of ownership last March, Adelaide United’s average attendance is dipping to the lowest in the club’s history.

Adelaide United
Don't miss out on the headlines from Adelaide United. Followed categories will be added to My News.
- Kosmina: Red flag over Kurz’s future
- Galloway backs Reds to rebound
- Kurz confirms meeting to discuss future
- Glory surge further with win over Reds
- Reds can’t go back to training ground
Adelaide United boss Marco Kurz’s side is still in the running to win a potential second A-League championship after winning the FFA Cup but the club isn’t rocking the turnstiles at Hindmarsh Stadium.
Adelaide’s average crowds for A-League matches have slumped to the Reds lowest in history since 2005.
This comes after the club’s second FFA Cup trophy success in October entertained 14,448 mostly thrilled fans on a Tuesday night at Hindmarsh.
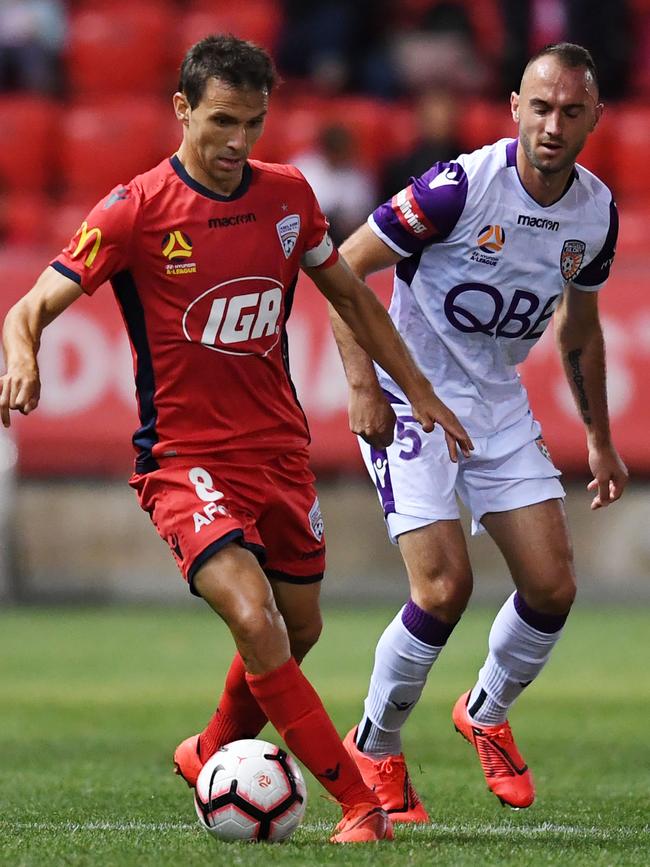
Last Friday Adelaide hosted Perth — fifth versus first.

The clash drew just 7853 fans. Its lowest was 7071 in a nailbiting 4-3 win over Brisbane Roar last month.
After a change of ownership last March the club rejuvenated its ticket pricing structure and despite the dollar savings which were published on the club’s website, fans are harder to attract to Hindmarsh Stadium than ever.
Reds chairman Piet van der Pol in August via the club’s website announced an advisory board “which will be an integral part of plans to professionalise the club and bring it closer to the South Australian community.”
“The opportunities to grow the game are there and Adelaide United can be the lightning rod for this growth,’’ van der Pol said at the time.
Before this season, Adelaide’s worst average attendance was 8829 in 2011/12 when it had a change of coach.
Rini Coolen stepped down for John Kosmina and the Reds ended second to bottom
The club is averaging 8748 compared to 9830 last season.
This season an average 1082 fans are not turning up.
This is despite Adelaide being in the top six for the entire season.
However Adelaide is not alone when it comes to a drop in average attendances.
The A-League has ‘lost’ a total average of 2899 fans despite four of the 10 clubs having an increase in attendances.
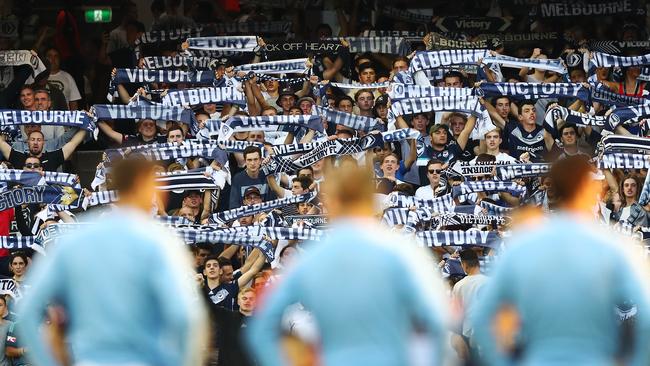
Melbourne Victory is attracting an average of 3457 more fans to its home matches.
This is probably due to the club being the reigning A-League champion and managing to sign Japanese marvel Keisuke Honda and Swedish striker Ola Toivonen as bona fide stars that featured at last year’s FIFA World Cup.
Mark Rudan’s influence on Wellington Phoenix has seen an increase of 2892 more fans wanting a piece of action.
Perth Glory in pole position to claim its maiden A-League Premier’s Plate has seen a slight 447 fans increase in WA.
Brisbane Roar having 1052 more average fans is somewhat of a shock as the club is sitting second to bottom.
The biggest drop in average crowds has hit Newcastle and Western Sydney. Those clubs have ‘lost’ an average of 3559 and 3434 fans respectively.
ADELAIDE UNITED
Average 2018/2019: 8748
Highest: 12,115 — Lowest: 7071
2017/18: 9830
Highest: 19,416 — Lowest: 7021
Difference: Minus 1082
BRISBANE ROAR
Average 2018/19: 10,145
Highest: 15,129 — Lowest: 7131
Average 2017/18: 9093
Highest: — 12,019 — Lowest: 5192
Difference: Plus 1052
CENTRAL COAST MARINERS
Average 2018/19: 5862
Highest: 8923 — Lowest: 3703
Average 2017/18: 7194
Highest: — 12,044 — Lowest: 4973
Difference: Minus 1332
MELBOURNE CITY
Average 2018/19: 8805
Highest: 24,306 — Lowest: 5149
Average 2017/18: 9728
Highest: 22,515 — Lowest: 5207
Difference: Minus 923
MELBOURNE VICTORY
Average 2018/19: 20,946
Highest: 40,504 — Lowest: 8039
Average 2017/18: 17,489
Highest: — 35,792 — Lowest: 8370
Difference: Plus 3457
NEWCASTLE JETS
Average 2018/19: 9001
Highest: 11,814 — Lowest: 6701
Average 2017/18: 12,560
Highest: 29,410 — Lowest: 6258
Difference: Minus 3559
PERTH GLORY
Average 2018/19: 9633
Highest: 11,393 — Lowest: 7213
Average 2017/18: 9186
Highest: 13,565 — Lowest: 7277
Difference: Plus 447
SYDNEY FC (before last night)
Average 2018/19: 14,471
Highest: 30,588 — Lowest: 10,101
Average 2017/18: 14,888
Highest: 36,057 — Lowest: 9110
Difference: Minus 417
WESTERN SYDNEY WANDERERS
Average 2018/19: 8490
Highest: 18,043 — Lowest: 5067
Average 2017/18: 11,924
Highest: — 36,433 Lowest: 6612
Difference: Minus 3434
WELLINGTON PHOENIX (before last night)
Average 2018/19: 8586
Highest: 23,648 — Lowest: 4829
Average 2017/18: 5694
Highest: 8154 Lowest: 4312
Difference: Plus 2892
Compared to last season’s average: 2899 fans are staying away after 22 rounds
Join the conversation

Reds slammed for ‘disgraceful’ actions
Adelaide United’s treatment of one the club’s former players has been described as ‘disgraceful’.
Read more

Roar interested in bringing young gun home
Brisbane Roar’s bid to rebuild their squad continues, while one of the Queensland club’s former players has moved to Melbourne Victory.
Read more