
Cancer Atlas brings deadly disease out for all to see
PINPOINTING cancer hot spots will help target prevention measures, health services and further research, writes science reporter Clare Peddie.

SEE BELOW: Interactive Cancer Atlas map
THE LIST: Pinpointing cancer in SA
- Cancer Atlas lets you compare suburbs for cancer rates
CANCER touches the lives of every South Australian, some more than others. But the deadly disease is a master of disguise, evading the immune system and staying hidden from view, often until it’s too late.
Now researchers have joined forces to put cancer on the map, revealing the relative risk in our suburbs, towns and rural areas, with this week’s launch of the Australian Cancer Atlas.
It’s there for all to see, on a freely accessible website atlas.cancer.org.au, giving everyone the chance to gain valuable intelligence on public enemy number one, the leading cause of premature death in Australia.
The surveillance data comes from each state and territory's cancer registry, adjusted for age and population size. (So the differences between geographical areas cannot be explained by differences in age.)
Several patterns emerge, as Cancer Council SA general manager of services, research and public policy Alana Sparrow explains. Some are well known, while others require further investigation.
Due to the size of the dataset, please give the map a few moment to load. If you’re experiencing issues, you can view the Australian Cancer Atlas here.
Suburbs with high lung cancer rates such as Elizabeth (where excess death rates are 80 per cent higher than average), Semaphore, Salisbury and Port Adelaide reflect past behaviour (namely smoking). Smoking is also associated with cancer of the head, neck and breast, she says.
Melanoma is prominent in country areas, where people spend more time out in the sun. Liver cancer is linked to excess alcohol consumption and hepatitis.
For many cancers, there are known “disparities in outcomes between metro and regional South Australians”.
This is most apparent in breast cancer, where the affluent suburban areas of Toorak Gardens, Rostrevor/Magill, Aldinga, Mitcham and Colonel Light Gardens have the highest breast cancer diagnosis rates, but these women are accessing treatment and living longer.
The risk of dying from breast cancer within five years of diagnosis (excess deaths) is highest in country towns, namely Whyalla (with the state’s lowest diagnosis rates), Millicent, Kimba/Cleve/Franklin Harbour and Mount Gambier. (The suburb of North Haven stands out here at number four. More on that later.)
Ms Sparrow says the atlas shows women in higher socio-economic areas are taking up breast screening and “it's working, catching them early, for effective treatment”, while screening programs could be better targeted to rural women.
The Cancer Council is also concerned about treatment for country people.
“We run two accommodation facilities for people from regional South Australia who need to come to Adelaide for treatment, so we know first-hand how hard the struggle is, how much more difficult it is when you have to travel,” Ms Sparrow said.
“I think we need to be very careful to make sure that we are supporting country people with cancer, so that they do choose the best possible treatment and they are completing their treatments in the same way that metropolitan South Australians are.
“We need to make sure that we are not neglecting them, we need to make it as easy as possible to get treatment, for what often can be six to eight weeks at a time, it's not an easy thing to do, so we need to make sure we are doing all we can to help them.”
At SA Health, Professor Katina D’Onise runs the SA Cancer Registry, as Director of the Prevention and Population Health Branch. She says the atlas can “potentially assist in identifying where additional services and research is needed”.
“It can help with planning for both treatment options and preventive activities, through initiatives such as the cancer screening programs for bowel cancer, breast cancer and cervical cancer,” she said.
“While the Cancer Atlas is a useful resource, unfortunately cancer has no geographic boundaries and it can affect anyone.
“Something that everyone can do is take preventive measures to reduce the likelihood of developing cancer, such as not smoking, maintaining a healthy weight, limiting alcohol intake and wearing sun protection.”
While some patterns can be explained by what we know about people living in different communities, such as people who smoke or who drink harmful levels of alcohol or the proportion who participate in cancer screening programs, others may need further investigation.
The Cancer Council is working with UniSA cancer epidemiology and population health Professor David Roder to identify these areas and then go back to the registry data to dig a little deeper.
One area of interest might be the LeFevre Peninsula, including North Haven and Semaphore.
Port Adelaide Resident's Environment Protection Group secretary Tony Bazeley said he noticed “a startling pattern” when he explored the atlas for the first time this week.
“Once diagnosed, people in the northwest suburbs are not surviving as well as others,” he said.
“This could be due to the quality of care, later stage diagnosis or a number of factors, but we need to investigate why generally cancer sufferers in the northwest suburbs are not surviving as well as those in other areas of Adelaide.”
The group has long fought for air quality monitoring around heavy industry and busy roads, together with the Semaphore Workers Club.
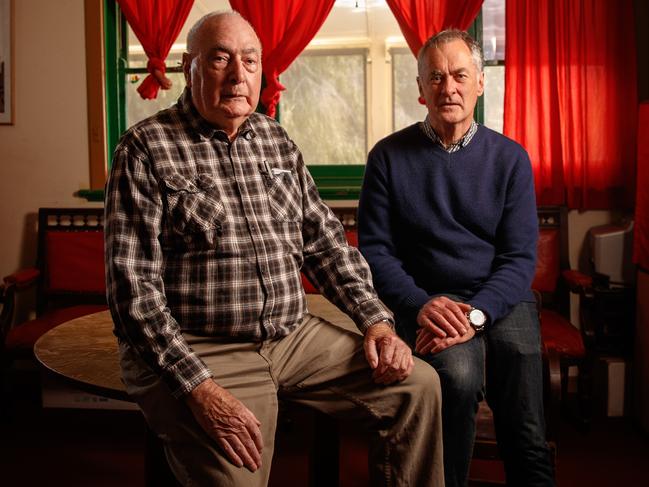
With a background in Occupational and Environmental Health and Safety, Len Lean has been gathering evidence to support this argument from all over the world. He can point to many studies connecting air pollution to lung cancer, even in people who never smoked.
Fellow Semaphore Workers Club Think Tank member Bob Briton is convinced environmental problems lie behind the cancer statistics on the LeFevre Peninsula.
“Unfortunately, the official attitude is that it's all socioeconomics, these are people who smoke and don't look after themselves,” he said.
“That shows a heavy class bias, we think … Sure it's hard to pin cancer down to the environmental issues but it is a real feature of the peninsula and older members of the club have this suspicion the cement works and other industry still on the peninsula play a part.”
Cancer diagnosis risk compared to the Australian average
LOWEST DIAGNOSIS RATE OVERALL
(% below average)
Roxby Downs23%
Nailsworth/Broadview19%
Burnside/Wattle Park 16%
Clare15%
Kangaroo Island13%
HIGHEST DIAGNOSIS RATE OVERALL
(% above average)
Renmark13%
North Haven11%
Elizabeth9%
Smithfield/Elizabeth North9%
Largs Bay/Semaphore8%
LOWEST BREAST CANCER DIAGNOSIS
(% below average)
Whyalla 21%
Port Pirie 17%
Yorke Peninsula (South) 15%
Murray Bridge 13%
Clare 12%
HIGHEST BREAST CANCER DIAGNOSIS
(% above average)
Toorak Gardens8%
Rostrevor/Magill 8%
Aldinga 7%
Mitcham 7%
Colonel Light Gardens 7%
LOWEST HEAD & NECK CANCER DIAGNOSIS
(% below average)
Redwood Park 32%
Aberfoyle Park 31%
Lobethal/Woodside 27%
Flagstaff Hill 27%
Coromandel Valley 27%
HIGHEST HEAD & NECK CANCER DIAGNOSIS
(% above average)
Renmark70%
Eyre Peninsula 65%
Port Lincoln 62%
Coober Pedy 53%
Port Pirie 52%
LOWEST LIVER CANCER DIAGNOSIS
(% above average)
Kangaroo Island 56%
Victor Harbor 42%
Yankalilla 41%
Goolwa/Port Elliot 39%
Willunga 39%
HIGHEST LIVER CANCER DIAGNOSIS
(% above average)
The Parks72%
Ceduna 67%
Woodville / Cheltenham 52%
APY Lands 44%
Beverley 40%
LOWEST LUNG CANCER DIAGNOSIS
(% below average)
Burnside/Wattle Park 45%
Hahndorf/Echunga 44%
Aldgate/Stirling 42%
Glenside/Beaumont 42%
Coromandel Valley 40%
HIGHEST LUNG CANCER DIAGNOSIS
(% above average)
Elizabeth 80%
Davoren Park 68%
Smithfield/Elizabeth North 68%
Ceduna 55%
Coober Pedy 45%
LOWEST MELANOMA DIAGNOSIS
(% below average)
Parafield Gardens 51%
Paralowie 49%
Salisbury 49%
Coober Pedy 49%
Salisbury North 49%
HIGHEST MELANOMA DIAGNOSIS
(% above average)
Port Lincoln 9%
Eyre Peninsula 8%
Port Pirie 7%
Strathalbyn 6%
Yorke Peninsula (South) 1%
LOWEST PROSTATE CANCER DIAGNOSIS
(% below average)
Murray Bridge 27%
APY Lands 27%
Port Lincoln 25%
Roxby Downs 25%
Western 20%
HIGHEST PROSTATE CANCER DIAGNOSIS
(% above average)
Renmark 29%
Naracoorte 25%
Millicent 21%
West Lakes 20%
Marino/Seaview Downs 20%
Risk of dying within five years of diagnosis compared to the Australian average
LOWEST EXCESS DEATHS
(% above average)
Uraidla / Summertown 14%
Panorama 13%
Aldgate / Stirling 12%
Athelstone 12%
Burnside / Wattle Park 11%
HIGHEST EXCESS DEATHS
(% above average)
Coober Pedy 45%
Ceduna 37%
Port Lincoln 37%
Flinders Ranges 35%
Davoren Park 33%
LOWEST EXCESS DEATHS BREAST CANCER
(% below average)
Berri 18%
Yorke Peninsula — South 18%
Loxton 15%
Brighton 13%
Athelstone 13%
HIGHEST EXCESS DEATHS BREAST CANCER
(% above average)
Whyalla 52%
Millicent 21%
Kimba/Cleve/Franklin Harbour 19%
North Haven 18%
Mount Gambier17%
LOWEST EXCESS DEATHS HEAD & NECK CANCER
(% below average)
Fulham 8%
Greenwith 5%
Henley Beach 5%
Blackwood 5%
Mitcham 5%
HIGHEST EXCESS DEATHS HEAD AND NECK CANCER
(% above average)
North Haven 33%
APY Lands 29%
Port Pirie 25%
Roxby Downs 25%
Western 25%
LOWEST EXCESS DEATHS LIVER CANCER
(% below average)
Henley Beach 25%
The Parks 24%
Parafield Gardens 21%
West Beach 20%
Ingle Farm 19%
HIGHEST EXCESS DEATHS LIVER CANCER
(% above average)
Port Lincoln 64%
Ceduna 59%
Murray Bridge 56%
Eyre Peninsula 47%
West Coast 45%
LOWEST EXCESS DEATHS LUNG CANCER
(% below average)
Mount Gambier 13%
Mount Barker 9%
Aberfoyle Park 9%
Rostrevor/Magill 8%
Happy Valley 7%
HIGHEST EXCESS DEATHS LUNG CANCER
(% above average)
Port Lincoln 40%
Largs Bay/Semaphore 22%
Salisbury North 17%
Elizabeth 17%
Port Adelaide 16%
LOWEST EXCESS DEATHS MELANOMA
(% below average)
Victor Harbor 5%
Mount Gambier 4%
Yorke Peninsula — South 3%
Penola 3%
Whyalla 2%
HIGHEST EXCESS DEATHS MELANOMA
(% above average)
Millicent 19%
Port Augusta 18%
Nairne 14%
Reynella 14%
Happy Valley 14%
LOWEST EXCESS DEATHS PROSTATE
(% below average)
North Haven 37%
Athelstone 36%
Rostrevor/Magill 34%
Modbury Heights 33%
Hope Valley/Modbury 33%
HIGHEST EXCESS DEATHS PROSTATE
(% above average)
Millicent 44%
Penola 14%
Coober Pedy 12%
Wattle Range 12%
Grant 12%