
Australian Cancer Atlas allows you to compare your suburb for cancer diagnosis and death rates
WHEN it comes to cancer, where you live can be a matter of life and death. Now a new online tool allows you to compare your suburb’s diagnosis and survival rates with the rest of the nation. SEE THE MAP

SA News
Don't miss out on the headlines from SA News. Followed categories will be added to My News.
WHEN it comes to cancer, where you live can be a matter of life and death. That’s why researchers created the Australian Cancer Atlas, launched today.
Everyone can access the interactive digital system online. Look up your suburb or town to see how diagnosis and survival rates compare with the national average for the 20 most common cancers.
The results may be surprising, or they may entirely predictable, based on socio-economic demographics, lifestyles and access to health services in the area.
Leafy eastern suburbs of Kensington Gardens, Wattle Park and Burnside appear to have less cancer diagnosed (16 per cent below average) and fewer cancer deaths than expected (“excess deaths” are 11 per cent below average), possibly reflecting healthy lifestyle choices and better access to services such as cancer screening and treatment. Rates of lung cancer, melanoma and thyroid cancer are well below average.
At the opposite end of the spectrum is North Haven, with relatively more cancer diagnosed (11 per cent above average) and fewer survivors with excess deaths at 21 per cent above average, particularly brain cancer deaths (53 per cent above average), head and neck cancer deaths (33 per cent above average) and non-Hodgkin’s lymphoma deaths (36 per cent above average).
Due to the size of the dataset, please give the map a few moment to load. If you’re experiencing issues, you can view the Australian Cancer Atlas here.
Cancer Council Queensland researchers led the ambitious project, building on the success of the Atlas of Cancer in Queensland.
Chief executive Chris McMillan said the charity was proud to launch the national atlas.
“In 2018 an estimated 138,000 Australians will be diagnosed with cancer, but we know that some people face greater risks of diagnosis and death than others, due to a mix of lifestyle, behaviour, genetics and other unknown factors,” he said.
“The atlas enables readers to easily visualise those differences and offers critical insight into patterns of cancer and outcomes in Australia, depending on where people live, which can be used to drive research and policies going forward.”
Senior research fellow in biostatistics, Pater Baade, says the atlas highlights some issues worth further investigation.
“Many areas of South Australia have a higher than average diagnosis rate for leukaemia,” he said.
“However, this may not reflect a real difference. Over time, especially the last 10 years, the clinical investigation of haematological conditions, including leukaemia, has increased in complexity.”
The high rate of leukaemia diagnosis does not equate to higher death rates, with below average results for excess leukaemia deaths statewide.
Cancer death rates are far higher than average in regional centres including: Coober Pedy (45 per cent), where liver cancer is a major problem; Ceduna (37 per cent above average) with liver plus oesophageal cancer, head and neck cancers the biggest concern, and Port Lincoln (37 per cent) from liver, kidney, lung and brain cancers.
Mr Baade said there were marked differences between indigenous and non-indigenous Australians in diagnosis rates of these and other types of cancer.
“Indigenous Australians have higher diagnosis rates of the more fatal cancer types such as lung cancer, liver cancer, head and neck cancers, pancreatic cancer and oesophageal cancer, and cervical and uterine cancers among indigenous women,” he said.
“In contrast, indigenous Australians have lower diagnosis rates of melanoma, breast cancer and prostate cancer, all of which have, on average, relatively good survival prognosis.”
However he said while areas in rural South Australia have a relatively high proportion of the population who are indigenous, this doesn’t appear to have impacted on the diagnosis patterns for these cancers in rural and remote areas of South Australia.
Step into Life personal trainer Ann-Kathrin Maxe, 57 of Kensington Gardens says her secret to good health is getting outdoors.
“It’s about making healthy choices, from nutrition to physical activity, but also feeling cared for, belonging to something is so important,” she said.
“We try to have fun, get fit and have that social camaraderie, that’s why people stay so long with us, if you feel happy and good you’re less likely to be sick.”
Best and the worst areas for cancer diagnosis and survival
LOWEST DIAGNOSIS RATE
Roxby Downs 23 per cent below average
Nailsworth-Broadview 19 per cent below average
Burnside/Wattle Park 16 per cent below average
LOWEST EXCESS DEATHS
Uraidla Summertown 14 per cent below average
Panorama 13 per cent below average
Aldgate/Stirling 12 per cent below average
HIGHEST DIAGNOSIS RATE
Renmark 13 per cent above average
North Haven 11 per cent above average
Elizabeth 9 per cent above average
HIGHEST EXCESS DEATHS
Coober Pedy 45 per cent above average
Ceduna 37 per cent above average
Port Lincoln 37 per cent above average
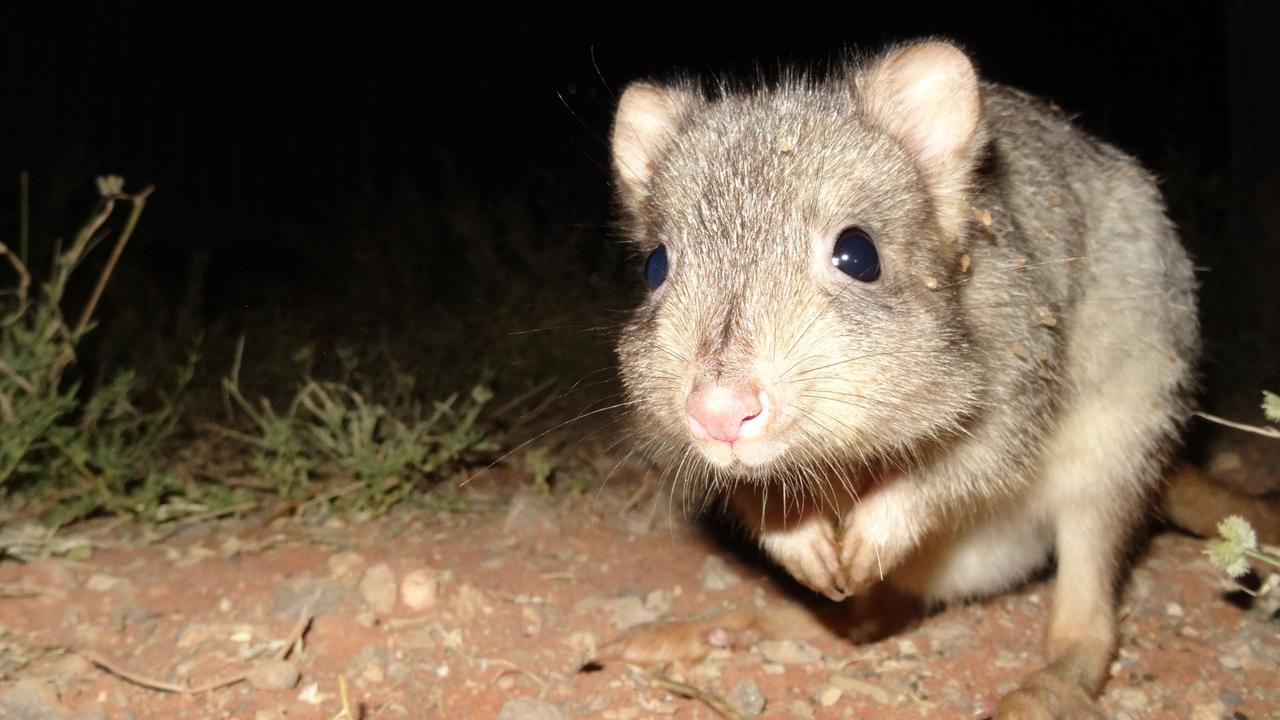
Battle to save animals on the brink at Outback reserve
Conservationists are battling to save animals at an Outback reserve from the effects of the worst drought in recent memory, and have received a funding boost to redouble their efforts.
Country tradie to face court over incomplete work
A country tradesman will face the Elizabeth Magistrates Court over allegations he was not licenced and refused to refund money to clients.