
Hot in the city — Urban heat mapping reveal Adeaide’s hottest and coolest suburbs
Adelaide’s hottest and coolest suburbs are revealed in maps allowing households to see how their homes and neighbourhoods are coping with urban heat. SEE HOW HOT YOUR SUBURB IS
Local
Don't miss out on the headlines from Local. Followed categories will be added to My News.
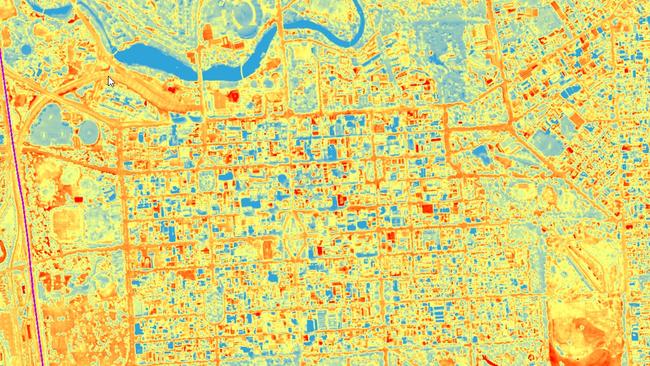
The impact of hot weather on Adelaide’s streets and suburbs has been captured on an interactive map allowing households to see how their homes and neighbourhoods are coping with urban heat.
The publicly accessible mapping tool, compiled by the Environment and Water Department and officially launched this week, details aerial thermal imaging of 16 council districts, except for Playford Council.
Users are able to switch between daytime and nightime surface temperature readings and drill down to individual addresses to see how their homes compare with their neighbours or other parts of the city.
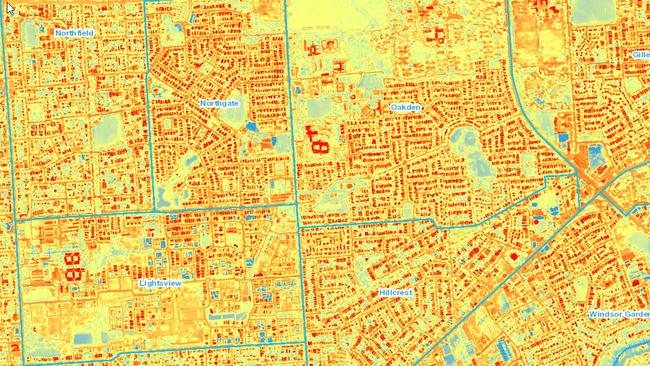
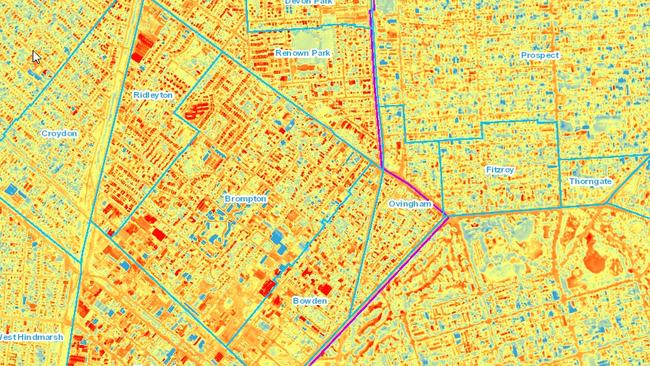
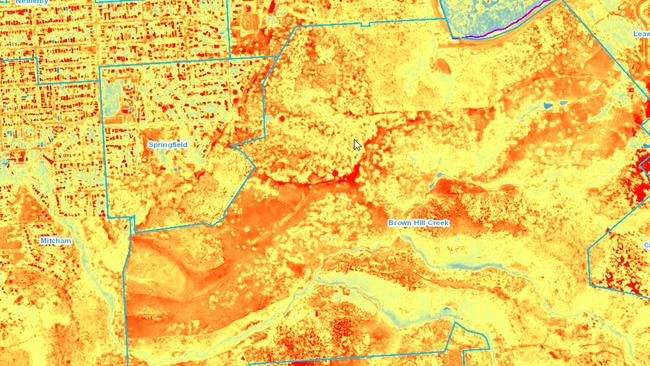
Colour-coded heat signatures — deep red for areas of extreme heat and blue for cooler locations — reveal that industrial estates in Adelaide’s west and north and vast tracks of inner urban housing are among our hottest locations.
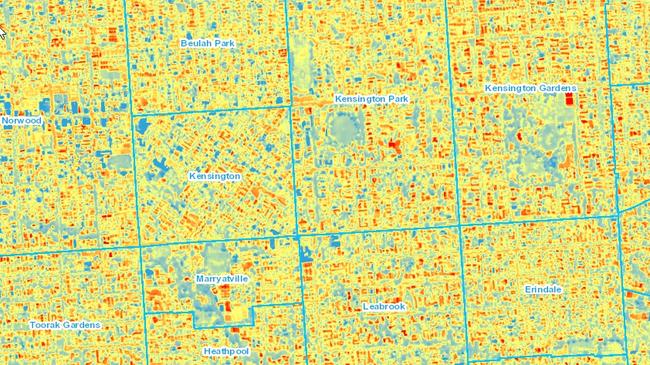
Properties along the coast and those in established suburbs with lots of street trees, such as in Adelaide’s east, are cooler.
HOT PROPERTY: ACCESS THE HEATMAP HERE
Authorities will use the resource to target more tree planting and designing infrastructure such as roads, shelters and playgrounds to minimise so called urban heat islands and counter rising temperatures caused by climate change.
It will also allow authorities to determine residents who may be at a higher risk of heat-related deaths.
CITY
NORTH
EAST
SOUTH

WEST
HILLS
It comes as Adelaide, Prospect, Walkerville, Unley, Campbelltown, Tea Tree Gully, Burnside, Norwood Payneham and St Peters and Salisbury are the latest to release results of heat mapping taken across their districts on March 10 last year, when the average maximum temperature was above 33C.
A report into the findings, released to The Advertiser, shows that Salisbury was the hottest council area with an average daytime surface temperature of 38.86C — 1.31C warmer than the regional average.
The council also recorded the top 10 suburbs for daytime heat, with Parafield — which includes an airport — the hottest at 40.55C, followed by Edinburgh at 39.95C and Dry Creek at 39.75C.
Burnside Council had the coolest daytime temperatures but the warmest nightime temperatures owing “a large part to the pronounced warming from the hills face zone”, report authors Adelaide-based Seed Consulting said.
“Similarly, Campbelltown and Tea Tree Gully were the second and third warmest councils (for nightime temperatures) because of this same pattern, averaging .5C warmer than the baseline temperature,” the report said.
Tea Tree Gully Council had the highest proportion of its area subject to so-called extreme temperature hot spots — where temperatures were 4C above average — owing to heat generated from exposed land in the council’s northeast.
Urban heat islands, defined as a 125m2 area recording a “disproportionate” build-up of heat, covered 17 per cent of the 312km2 study area.
The report found that Campbelltown Council, which wants to reduce block sizes owing to concerns over infill housing, had “nearly all” its heat islands located in areas where residents were less likely to be able cope with rising temperatures, such as the elderly, young and disabled.
“Given that urban heat islands are a relative measure, climate change will not necessarily increase the area effected by urban heat, however, the intensity of heat in these areas will likely increase,” the report said.
“Urban infill is another major driver of urban heat islands. The replacement of green open space in private backyards with roofs and surrounding impervious surfaces is already leading to an increase in the urban heat island effect.”
Among recommendations are:
DESPITE pressure from urban infill, green space and tree cover should be preferably increased to provide cooling benefits;
DRY grass and/or bare ground should be watered, where feasible, to reduce their daytime warming effect;
TREES, grass and raingardens should be used to shade bitumen covered surfaces such as roads, bikeways and footpaths.
ROAD surfaces painted with lighter colours or relaid with lighter materials and where feasible narrowed;
ENCOURAGING light coloured roofs, or where feasible, incorporating rooftop gardens in the design of multistorey structures such as carparks and apartments;
GUIDELINES should be developed for the amount of vegetation and landscaping required, and building materials to be used, in medium and high density developments, to mitigate heat islands.
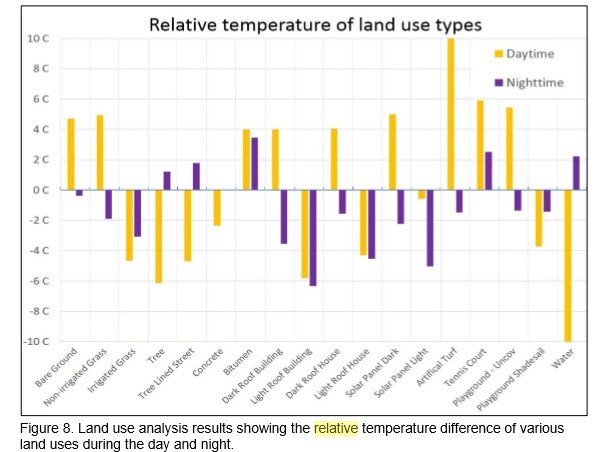
The study reinforced findings of similar studies that artificial turft, dark surfaces, and bitumen roads accumulated the most heat.
Artificial turf measured at Modbury Soccer Club was 11.4C warmer than average, 5C hotter than nearby tennis courts and 7C hotter than nearby car park.
“However, bare ground can have a significant warming effect, which was seen at sites such as Parafield Airport and non-irrigated part of the Adelaide Parklands.,” the report said.
“This suggests that where turf is installed ensuring access to a long-term sustainable water supply is essential for maintaining cooling benefits that (can) be achieved from living turf.”
Adelaide City Council sustainability associate director Michelle English said the heat mapping “clearly indicates” that the impacts of hot weather affects the community disproportionately and that trees and vegetation are needed to reduce impacts of urban heat and climate change.
“The information will assist us to target investment and assist our most vulnerable communities to be climate ready,” she said.
A similar heat mapping study was done for councils in Adelaide’s west in 2017 and for southern councils in 2016.
Join the conversation

Fast food and ‘deradicalisation’: Glenunga school bomb plot twist
A young Adelaide man who allegedly threatened to attack a high school and contaminate food wants to return to his job in the fast food industry on bail, a court heard.
Read more

Neo-Nazi demands SA taxpayers cough up for his legal bills
The Victorian leader of the National Socialist Network is no longer charged over a Survival Day protest in Adelaide – and now wants his legal fees paid for.
Read more