
Gold Digger: Gold is cool in a crisis and the history books prove it
If it feels like the global economy is burning that could be a hint that gold equities are about to outperform again.

Stockhead
Don't miss out on the headlines from Stockhead. Followed categories will be added to My News.
Gold tends to be cool in a crisis
TD Cowen analysis suggests gold equities outperformed the broader market by 16-24% in economic shocks since the year 2000
Alice Queen and Leeuwin Metals among this week's top gold gainers
Gold has once again proven itself cool in a crisis.
We don't need to regale you of all the tales you've read many times this week, including no doubt in Eddy Sunarto and Phoebe Shields' wonderful Lunch Wrap and Closing Bell columns, about the inferno which has engulfed equity markets this week on account of one President Trump.
In a nutshell. This.
https://t.co/cLKxvtK7kb pic.twitter.com/XLQ7scQxJo
— Kristie Batten (@kristiebatten) April 7, 2025
Thanks KB.
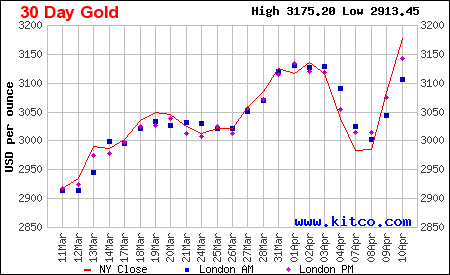
Gold's more of a chill guy though, and as the world's been burning bullion again crashed through record highs on Thursday. We're now at US$3215/oz, or $5164/oz Aussie for those of us whose toilets drain the right way.
This is all little surprise to the analysts at TD Cowen in the States.
Gold observers Wayne Lam, Steven Green and Kulvir Gill say gold has typically shone in previous crises. While gold miners haven't done so well in the immediate aftermath of a shock, they tend to outperform in the wash-up.
"Looking at three-month performance following an economic shock, we highlight past outperformance of gold equities vs. the S&P 500, including the COVID-19 period (+16% vs. SPX), Bear Stearns collapse (+22%), and the LTCM crisis (+24%)," Lam and his crew said in a note this week.
"Lastly, investor preference for gold as a relative safe haven has previously driven spikes in the gold/silver ratio, including the Global Financial Crisis (83x), COVID-19 (114x), and current U.S. tariffs (103x), with reversion in the months following as volatility subsides."
More interest to come
While gold may be knocking the lights out as near on everything hides for cover, generalist money is still favouring other areas of the market.
That suggests there's plenty of growth left in the recently high-performing gold equities market, TD's analysts say.
"We continue to view tepid investor interest in gold equities, with $2.6bln in outflows from the GDX/GDXJ in Q1/25 and $5.3bln over the past year despite an ~$870/oz increase in gold price," they said.
"In addition, while current precious metals weighting in the S&P/TSX has increased 2.2% YTD to 9.6%, this sits well below the high of 12.7% seen in mid-2020, with the current gold price $1,000/oz+ higher vs. prior levels.
"We view investors as underweight precious metals but we have seen a marked uptick in generalist interest evaluating greater allocation of capital back into the space."
The North American focused GDX ETF traded 9% down last Friday when the tariffs really hit.
But TD suggests that leaves global gold miners at a valuation of just 0.7x NAV, meaning valuations are attractive despite record high prices.
They think prices of just US$2492/oz are priced into gold equities in North America.
M&A will be a continuing focus, as will ramping up shareholder returns.
"Key themes through our recent marketing include discounted equity valuations, capital returns, and consolidation," the analysts said.
"Generalist interest has increased, but remains cautious amidst market uncertainty, with discussions around capital allocation strategies and a potential increase in shareholder returns to incentivise non-resource investors back into the space."
Winners & Losers
Here’s how ASX-listed precious metals stocks are performing:
| CODE | COMPANY | PRICE | WEEK % | MONTH % | 6 MONTH % | YEAR % | YTD % | MARKET CAP |
|---|---|---|---|---|---|---|---|---|
| MRR | Minrex Resources Ltd | 0.009 | 13% | 29% | 13% | -31% | 29% | $ 8,678,940.02 |
| NPM | Newpeak Metals | 0.011 | -8% | -27% | -21% | 23% | 0% | $ 3,542,789.04 |
| ASO | Aston Minerals Ltd | 0.015 | -17% | -12% | 25% | 25% | 67% | $ 19,425,964.04 |
| MTC | Metalstech Ltd | 0.1 | -5% | -17% | -33% | -41% | -29% | $ 18,766,250.89 |
| GED | Golden Deeps | 0.016 | -20% | -24% | -53% | -63% | -36% | $ 3,011,136.92 |
| G88 | Golden Mile Res Ltd | 0.009 | 0% | -10% | -31% | -31% | 0% | $ 4,353,982.84 |
| LAT | Latitude 66 Limited | 0.051 | -18% | -18% | -54% | -75% | 34% | $ 7,743,638.07 |
| NMR | Native Mineral Res | 0.115 | 5% | 64% | 271% | 326% | 195% | $ 86,800,647.05 |
| AQX | Alice Queen Ltd | 0.006 | 50% | 0% | -25% | -14% | -25% | $ 6,881,340.41 |
| SLZ | Sultan Resources Ltd | 0.006 | -14% | -14% | 0% | -45% | 0% | $ 1,620,289.37 |
| KSN | Kingston Resources | 0.085 | -1% | 9% | 2% | 18% | 20% | $ 69,866,166.76 |
| AMI | Aurelia Metals Ltd | 0.23 | -4% | 12% | 28% | 24% | 35% | $ 372,365,980.80 |
| GIB | Gibb River Diamonds | 0.034 | 0% | -15% | -11% | 6% | -15% | $ 6,864,302.24 |
| KCN | Kingsgate Consolid. | 1.545 | 5% | 7% | 12% | 5% | 20% | $ 373,739,953.40 |
| TMX | Terrain Minerals | 0.0035 | 17% | -13% | 0% | -13% | 17% | $ 6,010,669.80 |
| BNR | Bulletin Res Ltd | 0.065 | 41% | 59% | 59% | 35% | 67% | $ 16,442,346.09 |
| NXM | Nexus Minerals Ltd | 0.0735 | -10% | 29% | 34% | -10% | 63% | $ 32,210,991.58 |
| SKY | SKY Metals Ltd | 0.04 | -22% | -20% | -18% | -7% | -26% | $ 31,981,642.47 |
| LM8 | Lunnonmetalslimited | 0.22 | 5% | 19% | -19% | -17% | -12% | $ 45,228,775.67 |
| CST | Castile Resources | 0.071 | -1% | 11% | -8% | -9% | -11% | $ 21,402,400.60 |
| YRL | Yandal Resources | 0.125 | -4% | -11% | 33% | -11% | -29% | $ 40,200,547.66 |
| FAU | First Au Ltd | 0.002 | -20% | 0% | 100% | 0% | 0% | $ 4,143,986.55 |
| ARL | Ardea Resources Ltd | 0.4 | -6% | -8% | -11% | -44% | 21% | $ 81,869,995.15 |
| GWR | GWR Group Ltd | 0.089 | 5% | 6% | 2% | -11% | 11% | $ 28,477,385.64 |
| IVR | Investigator Res Ltd | 0.022 | -4% | 10% | -42% | -60% | 10% | $ 34,955,350.63 |
| GTR | Gti Energy Ltd | 0.003 | 0% | 0% | -40% | -57% | -14% | $ 8,996,848.99 |
| IPT | Impact Minerals | 0.005 | 0% | -29% | -56% | -62% | -47% | $ 18,513,316.32 |
| BNZ | Benzmining | 0.41 | 3% | 1% | 141% | 173% | 19% | $ 51,241,890.08 |
| MOH | Moho Resources | 0.003 | -25% | -40% | -50% | -50% | -40% | $ 2,192,623.72 |
| BCM | Brazilian Critical | 0.007 | -13% | -30% | -42% | -65% | -22% | $ 7,440,710.12 |
| PUA | Peak Minerals Ltd | 0.011 | -8% | 22% | 467% | 356% | 42% | $ 25,265,891.61 |
| MRZ | Mont Royal Resources | 0.041 | 0% | 0% | -23% | -35% | -5% | $ 3,486,221.51 |
| SMS | Starmineralslimited | 0.024 | -11% | -20% | -56% | -36% | -33% | $ 3,491,553.02 |
| MVL | Marvel Gold Limited | 0.0115 | -12% | 15% | 5% | 15% | 28% | $ 11,877,122.17 |
| PRX | Prodigy Gold NL | 0.002 | 0% | -20% | 0% | -25% | 0% | $ 6,350,111.10 |
| AAU | Antilles Gold Ltd | 0.004 | 14% | -20% | 0% | -79% | 33% | $ 8,505,470.73 |
| CWX | Carawine Resources | 0.096 | -9% | 0% | -4% | -13% | -4% | $ 22,668,043.10 |
| RND | Rand Mining Ltd | 1.79 | 1% | 5% | -8% | 14% | 18% | $ 101,807,970.19 |
| CAZ | Cazaly Resources | 0.013 | -13% | 0% | 0% | -35% | -7% | $ 6,458,241.87 |
| BMR | Ballymore Resources | 0.115 | -12% | -12% | -23% | -12% | -4% | $ 20,324,017.28 |
| DRE | Dreadnought Resources Ltd | 0.012 | -8% | -29% | -33% | -37% | 0% | $ 56,038,000.00 |
| ZNC | Zenith Minerals Ltd | 0.052 | -5% | 16% | 6% | -47% | 30% | $ 21,186,953.94 |
| REZ | Resourc & En Grp Ltd | 0.022 | -19% | -4% | -19% | 69% | -4% | $ 15,447,699.81 |
| LEX | Lefroy Exploration | 0.078 | -8% | -10% | 3% | -40% | 11% | $ 19,376,770.76 |
| ERM | Emmerson Resources | 0.125 | -11% | 14% | 166% | 160% | 62% | $ 79,452,359.88 |
| AM7 | Arcadia Minerals | 0.017 | 0% | -15% | -53% | -82% | -11% | $ 1,760,751.50 |
| ADT | Adriatic Metals | 4.23 | -1% | -6% | 17% | 1% | 8% | $ 1,228,031,867.36 |
| AS1 | Asara Resources Ltd | 0.052 | 16% | 58% | 189% | 478% | 174% | $ 57,261,248.10 |
| CYL | Catalyst Metals | 6.18 | 7% | 32% | 110% | 713% | 140% | $ 1,343,320,788.92 |
| CHN | Chalice Mining Ltd | 0.955 | -9% | -30% | -36% | -33% | -14% | $ 363,740,046.78 |
| KAL | Kalgoorliegoldmining | 0.075 | 29% | 10% | 213% | 127% | 317% | $ 25,449,838.24 |
| MLS | Metals Australia | 0.02 | 0% | -5% | -23% | -9% | -13% | $ 15,303,110.00 |
| ADN | Andromeda Metals Ltd | 0.009 | 13% | 13% | 6% | -55% | 29% | $ 24,001,093.82 |
| MEI | Meteoric Resources | 0.067 | 12% | 0% | -30% | -72% | -21% | $ 163,580,394.74 |
| SRN | Surefire Rescs NL | 0.003 | 0% | 0% | -50% | -70% | -14% | $ 7,248,923.44 |
| WA8 | Warriedarresourltd | 0.063 | 7% | 37% | 13% | 37% | 43% | $ 57,412,920.54 |
| HMX | Hammer Metals Ltd | 0.023 | -8% | -18% | -41% | -50% | -30% | $ 20,418,450.10 |
| WCN | White Cliff Min Ltd | 0.0165 | 3% | -3% | -28% | -3% | 3% | $ 28,432,061.22 |
| AVM | Advance Metals Ltd | 0.04 | -9% | -9% | 90% | 14% | 18% | $ 8,347,358.53 |
| ASR | Asra Minerals Ltd | 0.003 | 0% | 50% | -40% | -63% | 0% | $ 7,119,380.49 |
| ARI | Arika Resources | 0.023 | 21% | -4% | -23% | 15% | -15% | $ 13,937,190.04 |
| CTO | Citigold Corp Ltd | 0.004 | 0% | 0% | 0% | -20% | 0% | $ 12,000,000.00 |
| SMI | Santana Minerals Ltd | 0.495 | -7% | -19% | -34% | 13% | 2% | $ 325,223,403.75 |
| M2R | Miramar | 0.003 | -25% | -14% | -63% | -76% | 0% | $ 1,369,040.33 |
| MHC | Manhattan Corp Ltd | 0.016 | -6% | -16% | -60% | -68% | -16% | $ 3,758,382.37 |
| GRL | Godolphin Resources | 0.01 | 0% | -23% | -31% | -70% | -31% | $ 4,488,733.12 |
| SVG | Savannah Goldfields | 0.014 | -7% | 0% | -24% | -36% | -24% | $ 8,982,078.55 |
| EMC | Everest Metals Corp | 0.15 | -3% | -9% | 20% | 36% | 11% | $ 32,448,656.22 |
| GUL | Gullewa Limited | 0.075 | 56% | 15% | 15% | 34% | 34% | $ 13,953,419.01 |
| CY5 | Cygnus Metals Ltd | 0.089 | -1% | -26% | 9% | 41% | -11% | $ 75,608,318.72 |
| G50 | G50Corp Ltd | 0.1 | -17% | -33% | -46% | -41% | -35% | $ 16,059,765.90 |
| ADV | Ardiden Ltd | 0.14 | -3% | 0% | 0% | -15% | 4% | $ 8,752,450.84 |
| AAR | Astral Resources NL | 0.165 | -3% | 22% | 57% | 154% | 22% | $ 223,502,446.72 |
| VMC | Venus Metals Cor Ltd | 0.1025 | -7% | 7% | 86% | 3% | 53% | $ 19,612,868.30 |
| NAE | New Age Exploration | 0.0045 | 0% | -10% | -10% | 13% | 29% | $ 10,637,595.64 |
| VKA | Viking Mines Ltd | 0.007 | -13% | -13% | -36% | -22% | -13% | $ 9,297,031.24 |
| LCL | LCL Resources Ltd | 0.006 | -14% | -33% | -33% | -45% | -40% | $ 7,168,876.24 |
| MTH | Mithril Silver Gold | 0.365 | 0% | -4% | -22% | 83% | -9% | $ 48,101,962.26 |
| ADG | Adelong Gold Limited | 0.0045 | -10% | 13% | 29% | 29% | 0% | $ 6,987,430.99 |
| RMX | Red Mount Min Ltd | 0.007 | -13% | -13% | -13% | -53% | -22% | $ 3,254,704.57 |
| PRS | Prospech Limited | 0.024 | -11% | -4% | -20% | -37% | -17% | $ 7,891,821.29 |
| TTM | Titan Minerals | 0.39 | 3% | -1% | -14% | 44% | 3% | $ 93,632,515.56 |
| AKA | Aureka Limited | 0.15 | 0% | -6% | -98% | -98% | 11% | $ 15,365,234.40 |
| AAM | Aumegametals | 0.042 | 0% | -5% | -19% | -25% | 0% | $ 25,976,860.81 |
| KZR | Kalamazoo Resources | 0.078 | -4% | 7% | -10% | -22% | 5% | $ 16,123,300.81 |
| BCN | Beacon Minerals | 0.026 | -7% | 0% | 16% | -10% | 18% | $ 114,111,833.18 |
| MAU | Magnetic Resources | 1.4 | -5% | 1% | 7% | 46% | 27% | $ 373,570,376.20 |
| BC8 | Black Cat Syndicate | 1.075 | 9% | 16% | 107% | 330% | 90% | $ 648,201,194.66 |
| EM2 | Eagle Mountain | 0.005 | 0% | 0% | -88% | -91% | -44% | $ 5,675,186.45 |
| EMR | Emerald Res NL | 4.1 | 6% | 2% | 5% | 18% | 26% | $ 2,497,663,688.40 |
| BYH | Bryah Resources Ltd | 0.004 | 0% | 33% | 0% | -56% | 33% | $ 3,479,814.09 |
| HCH | Hot Chili Ltd | 0.435 | -18% | -36% | -47% | -64% | -38% | $ 68,218,267.05 |
| WAF | West African Res Ltd | 2.31 | -1% | 3% | 62% | 72% | 61% | $ 2,564,530,983.00 |
| MEU | Marmota Limited | 0.038 | 1% | -14% | 3% | -17% | -3% | $ 48,310,537.39 |
| NVA | Nova Minerals Ltd | 0.275 | 2% | -15% | 67% | 8% | -26% | $ 83,901,328.42 |
| SVL | Silver Mines Limited | 0.094 | -2% | 19% | 0% | -51% | 21% | $ 163,739,336.06 |
| PGD | Peregrine Gold | 0.17 | -26% | 55% | 3% | -24% | 21% | $ 14,424,115.97 |
| ICL | Iceni Gold | 0.069 | -1% | -14% | 77% | 165% | -3% | $ 23,091,410.93 |
| FG1 | Flynngold | 0.023 | -12% | 5% | -18% | -55% | -8% | $ 7,388,089.21 |
| WWI | West Wits Mining Ltd | 0.019 | 6% | 12% | 27% | 19% | 36% | $ 47,252,101.01 |
| RML | Resolution Minerals | 0.008 | 14% | -43% | -50% | -67% | -33% | $ 3,680,507.99 |
| AAJ | Aruma Resources Ltd | 0.011 | 10% | 0% | -35% | -45% | -8% | $ 2,220,581.72 |
| HWK | Hawk Resources. | 0.02 | -9% | -9% | -33% | -63% | -9% | $ 5,418,588.98 |
| GMN | Gold Mountain Ltd | 0.0015 | -25% | -25% | -50% | -63% | -50% | $ 6,868,834.77 |
| MEG | Megado Minerals Ltd | 0.011 | -27% | -21% | -23% | 5% | -35% | $ 4,616,515.88 |
| HMG | Hamelingoldlimited | 0.07 | -17% | 35% | 8% | -15% | 9% | $ 11,541,300.00 |
| BM8 | Battery Age Minerals | 0.053 | -13% | -16% | -52% | -45% | -50% | $ 7,028,719.97 |
| TBR | Tribune Res Ltd | 4.7 | -4% | -3% | 4% | 12% | 10% | $ 252,371,450.37 |
| FML | Focus Minerals Ltd | 0.225 | 2% | 7% | 61% | 25% | 32% | $ 63,042,901.90 |
| VRC | Volt Resources Ltd | 0.004 | 0% | 0% | 0% | -20% | 33% | $ 21,081,500.92 |
| ARV | Artemis Resources | 0.0075 | -6% | -6% | -42% | -58% | -6% | $ 17,699,705.16 |
| HRN | Horizon Gold Ltd | 0.445 | -1% | 9% | 16% | 48% | -7% | $ 60,832,767.66 |
| CLA | Celsius Resource Ltd | 0.0065 | 8% | -28% | -46% | -54% | -41% | $ 20,352,998.40 |
| QML | Qmines Limited | 0.043 | 5% | 0% | -53% | -43% | -20% | $ 18,442,824.10 |
| RDN | Raiden Resources Ltd | 0.005 | 11% | 0% | -87% | -84% | -55% | $ 17,254,457.21 |
| TCG | Turaco Gold Limited | 0.42 | 4% | 27% | 27% | 127% | 65% | $ 360,952,584.40 |
| KCC | Kincora Copper | 0.023 | -4% | -15% | -47% | -41% | -15% | $ 5,688,092.90 |
| GBZ | GBM Rsources Ltd | 0.008 | -11% | 0% | 0% | -27% | 0% | $ 9,368,559.82 |
| DTM | Dart Mining NL | 0.0045 | -10% | -25% | -68% | -88% | -50% | $ 2,751,055.66 |
| MKR | Manuka Resources. | 0.03 | 7% | 3% | -46% | -66% | 7% | $ 23,512,262.40 |
| AUC | Ausgold Limited | 0.54 | 2% | 10% | 7% | 59% | 29% | $ 185,613,030.20 |
| ANX | Anax Metals Ltd | 0.006 | -20% | -25% | -67% | -79% | -50% | $ 5,296,845.40 |
| EMU | EMU NL | 0.022 | -19% | -24% | -8% | -20% | -19% | $ 4,259,231.00 |
| SFM | Santa Fe Minerals | 0.038 | -5% | -7% | 3% | -19% | 23% | $ 2,767,113.98 |
| SSR | SSR Mining Inc. | 15.77 | 0% | 0% | 93% | 117% | 45% | $ 55,398,117.60 |
| PNRDA | Pantoro Limited | 2.54 | 0% | 3% | 20% | 94% | 66% | $ 925,683,851.41 |
| CMM | Capricorn Metals | 9.21 | 14% | 20% | 60% | 72% | 47% | $ 3,830,776,307.19 |
| X64 | Ten Sixty Four Ltd | 0 | -100% | -100% | -100% | -100% | -100% | $ 129,844,903.32 |
| VRL | Verity Resources | 0.012 | -5% | -18% | -59% | -82% | -38% | $ 2,396,427.29 |
| HAW | Hawthorn Resources | 0.042 | -19% | -5% | -29% | -41% | 2% | $ 14,070,655.75 |
| BGD | Bartongoldholdings | 0.4 | 8% | 40% | 63% | 45% | 63% | $ 87,569,870.80 |
| SVY | Stavely Minerals Ltd | 0.014 | -13% | -18% | -59% | -56% | -18% | $ 8,160,631.40 |
| AGC | AGC Ltd | 0.16 | 0% | -6% | -29% | 116% | 3% | $ 41,055,555.52 |
| RGL | Riversgold | 0.0045 | -10% | 0% | 13% | -36% | 13% | $ 7,576,706.67 |
| TSO | Tesoro Gold Ltd | 0.028 | -10% | 4% | -13% | -7% | 40% | $ 43,495,593.15 |
| GUE | Global Uranium | 0.05 | -12% | -30% | -32% | -50% | -17% | $ 14,146,535.71 |
| CPM | Coopermetalslimited | 0.034 | -15% | -15% | -37% | -68% | -26% | $ 2,664,092.10 |
| MM8 | Medallion Metals. | 0.255 | -2% | 70% | 249% | 286% | 113% | $ 114,902,560.80 |
| FFM | Firefly Metals Ltd | 0.795 | -8% | -21% | -24% | -2% | -14% | $ 434,793,529.94 |
| CBY | Canterbury Resources | 0.023 | -12% | -15% | -30% | -4% | 5% | $ 4,541,140.61 |
| SLA | Solara Minerals | 0.125 | 14% | -11% | -58% | -40% | 39% | $ 7,248,102.88 |
| SFR | Sandfire Resources | 9.15 | -4% | -18% | -16% | 3% | -1% | $ 4,265,958,294.90 |
| SMG | Silvermetalgroupltd | 0 | -100% | -100% | -100% | -100% | -100% | $ 4,881,135.48 |
| TAM | Tanami Gold NL | 0.03 | 3% | 5% | -9% | -23% | 0% | $ 35,252,911.38 |
| NWM | Norwest Minerals | 0.009 | -10% | 0% | -57% | -80% | -36% | $ 4,366,075.59 |
| ALK | Alkane Resources Ltd | 0.7 | 4% | 10% | 52% | 6% | 37% | $ 408,740,777.10 |
| BMO | Bastion Minerals | 0.003 | 0% | -25% | -50% | -63% | -25% | $ 2,534,173.99 |
| IDA | Indiana Resources | 0.079 | 1% | 7% | 52% | 86% | 30% | $ 48,847,666.81 |
| GSM | Golden State Mining | 0.008 | 0% | -11% | -27% | -33% | 0% | $ 2,234,965.04 |
| NSM | Northstaw | 0.039 | 0% | 22% | 179% | 19% | 144% | $ 9,715,515.75 |
| GSN | Great Southern | 0.02 | -9% | -13% | 25% | -5% | 33% | $ 20,932,890.09 |
| VAU | Vault Minerals Ltd | 0.45 | 2% | 6% | 41% | 10% | 36% | $ 2,925,063,554.26 |
| DEG | De Grey Mining | 2.49 | 16% | 24% | 80% | 89% | 41% | $ 5,659,459,010.72 |
| THR | Thor Energy PLC | 0.01 | -17% | -23% | -29% | -55% | -23% | $ 7,107,898.35 |
| CDR | Codrus Minerals Ltd | 0.016 | -6% | -27% | -20% | -62% | -6% | $ 2,646,200.06 |
| MDI | Middle Island Res | 0.02 | 11% | 33% | 25% | 25% | 67% | $ 4,684,105.80 |
| WTM | Waratah Minerals Ltd | 0.16 | 0% | 3% | -48% | 52% | 3% | $ 30,358,124.85 |
| POL | Polymetals Resources | 0.87 | -6% | 14% | 112% | 241% | 9% | $ 195,514,986.45 |
| RDS | Redstone Resources | 0.0035 | 0% | 0% | -13% | -13% | 40% | $ 2,776,135.38 |
| NAG | Nagambie Resources | 0.017 | -6% | 13% | 31% | 42% | -6% | $ 14,459,442.19 |
| BGL | Bellevue Gold Ltd | 1.145 | 0% | -13% | -15% | -41% | 2% | $ 1,469,907,307.95 |
| GBR | Greatbould Resources | 0.084 | 11% | 17% | 50% | 35% | 95% | $ 57,024,630.68 |
| KAI | Kairos Minerals Ltd | 0.02 | 0% | 18% | 60% | 54% | 67% | $ 49,987,331.59 |
| KAU | Kaiser Reef | 0.17 | -3% | 3% | 10% | 10% | 6% | $ 52,122,112.00 |
| HRZ | Horizon | 0.062 | 9% | 3% | 19% | 63% | 55% | $ 126,275,317.93 |
| CDTDA | Castle Minerals | 0.06 | 0% | 0% | -33% | -67% | 0% | $ 3,793,628.22 |
| RSG | Resolute Mining | 0.4575 | 4% | 12% | -36% | -5% | 16% | $ 936,782,005.72 |
| MXR | Maximus Resources | 0.077 | -6% | 20% | 67% | 132% | 33% | $ 33,424,752.21 |
| EVN | Evolution Mining Ltd | 7.65 | 8% | 20% | 70% | 95% | 59% | $ 14,296,982,604.24 |
| CXU | Cauldron Energy Ltd | 0.008 | -11% | -11% | -56% | -81% | -33% | $ 12,421,939.18 |
| DLI | Delta Lithium | 0.155 | -9% | -14% | -42% | -48% | -9% | $ 111,063,977.76 |
| ALY | Alchemy Resource Ltd | 0.006 | 0% | -14% | 0% | -14% | -14% | $ 7,068,457.54 |
| NH3 | Nh3Cleanenergyltd | 0.025 | 0% | 14% | 25% | 19% | 39% | $ 14,115,119.63 |
| OBM | Ora Banda Mining Ltd | 1.235 | 15% | 18% | 101% | 312% | 90% | $ 2,034,056,481.48 |
| AVW | Avira Resources Ltd | 0.006 | -33% | -25% | -70% | -70% | -70% | $ 1,098,676.37 |
| LCY | Legacy Iron Ore | 0.009 | -10% | -18% | -28% | -38% | -10% | $ 87,858,383.26 |
| PDI | Predictive Disc Ltd | 0.38 | 1% | 21% | 55% | 58% | 65% | $ 914,472,373.85 |
| MAT | Matsa Resources | 0.056 | -2% | -2% | 47% | 47% | 60% | $ 43,238,323.93 |
| ZAG | Zuleika Gold Ltd | 0.011 | 10% | -8% | -21% | -42% | -15% | $ 8,160,679.20 |
| GML | Gateway Mining | 0.024 | -4% | 14% | 0% | 9% | 14% | $ 9,811,687.08 |
| SBM | St Barbara Limited | 0.2325 | -3% | 6% | -34% | -15% | 3% | $ 227,397,731.61 |
| SBR | Sabre Resources | 0.007 | 0% | -22% | -53% | -63% | -30% | $ 2,750,733.53 |
| STK | Strickland Metals | 0.092 | 5% | 8% | 15% | -23% | 8% | $ 185,422,838.33 |
| CEL | Challenger Gold Ltd | 0.062 | 9% | 11% | 29% | -31% | 32% | $ 99,576,641.18 |
| GG8 | Gorilla Gold Mines | 0.415 | -7% | 6% | 108% | 1080% | 60% | $ 263,349,798.60 |
| NST | Northern Star | 21.235 | 15% | 23% | 34% | 42% | 38% | $ 23,206,636,611.60 |
| OZM | Ozaurum Resources | 0.12 | 30% | 74% | 216% | 161% | 300% | $ 22,443,485.43 |
| TG1 | Techgen Metals Ltd | 0.025 | -11% | -17% | -29% | -29% | -29% | $ 4,125,308.46 |
| XAM | Xanadu Mines Ltd | 0.056 | 6% | 8% | -23% | -26% | 14% | $ 108,995,260.69 |
| AQI | Alicanto Min Ltd | 0.03 | 0% | -9% | 50% | 26% | -19% | $ 25,444,289.28 |
| KTA | Krakatoa Resources | 0.009 | 6% | 0% | -14% | 13% | -5% | $ 5,581,206.23 |
| ARN | Aldoro Resources | 0.385 | 10% | 12% | 413% | 413% | 1% | $ 65,642,508.45 |
| WGX | Westgold Resources. | 2.955 | 3% | 16% | 17% | 41% | 4% | $ 2,659,569,325.80 |
| MBK | Metal Bank Ltd | 0.011 | -21% | -35% | -44% | -41% | -27% | $ 5,472,048.98 |
| A8G | Australasian Metals | 0.066 | -12% | -18% | -47% | 5% | -16% | $ 3,820,721.85 |
| TAR | Taruga Minerals | 0.009 | 0% | 0% | -10% | 50% | -10% | $ 7,060,267.85 |
| DTR | Dateline Resources | 0.006 | 0% | 50% | 20% | -52% | 71% | $ 15,393,411.72 |
| GOR | Gold Road Res Ltd | 3.045 | 4% | 18% | 76% | 78% | 49% | $ 3,346,109,104.80 |
| S2R | S2 Resources | 0.1 | 1% | 47% | 25% | -23% | 49% | $ 47,550,089.27 |
| NES | Nelson Resources. | 0.0025 | -17% | -17% | 25% | -38% | -17% | $ 5,429,819.15 |
| TLM | Talisman Mining | 0.145 | -6% | -9% | -33% | -40% | -29% | $ 27,306,450.61 |
| BEZ | Besragoldinc | 0.042 | -2% | 50% | -49% | -63% | -53% | $ 17,450,535.94 |
| PRU | Perseus Mining Ltd | 3.38 | 2% | 10% | 29% | 49% | 32% | $ 4,542,117,308.36 |
| SPQ | Superior Resources | 0.005 | -17% | -17% | -29% | -58% | -17% | $ 11,854,913.63 |
| PUR | Pursuit Minerals | 0.045 | 0% | -38% | -70% | -80% | -53% | $ 4,488,028.34 |
| RMS | Ramelius Resources | 2.665 | 10% | -4% | 23% | 38% | 29% | $ 3,004,154,881.00 |
| PKO | Peako Limited | 0.003 | 0% | 0% | -25% | -22% | 0% | $ 4,463,225.88 |
| ICG | Inca Minerals Ltd | 0.005 | -9% | -9% | 0% | 0% | 0% | $ 5,727,251.40 |
| A1G | African Gold Ltd. | 0.125 | 25% | 98% | 166% | 286% | 127% | $ 52,802,180.86 |
| NMG | New Murchison Gold | 0.015 | 0% | 25% | 88% | 150% | 67% | $ 147,462,751.61 |
| GNM | Great Northern | 0.014 | 0% | -13% | 0% | 8% | 0% | $ 2,164,807.08 |
| KRM | Kingsrose Mining Ltd | 0.032 | -6% | -11% | -16% | -16% | -9% | $ 23,359,322.09 |
| BTR | Brightstar Resources | 0.021 | 5% | 5% | 24% | 8% | 5% | $ 239,529,476.97 |
| RRL | Regis Resources | 4.555 | 14% | 38% | 120% | 116% | 79% | $ 3,316,547,252.26 |
| M24 | Mamba Exploration | 0.01 | -23% | -23% | -23% | -63% | -17% | $ 3,246,821.71 |
| TRM | Truscott Mining Corp | 0.059 | -16% | -19% | -18% | -1% | -24% | $ 11,486,913.60 |
| TNC | True North Copper | 0.21 | -19% | -35% | -92% | -98% | -93% | $ 27,684,583.52 |
| MOM | Moab Minerals Ltd | 0.001 | -33% | -33% | -75% | -80% | -50% | $ 1,733,666.03 |
| KNB | Koonenberrygold | 0.053 | -2% | 71% | 308% | 165% | 342% | $ 42,342,936.48 |
| AWJ | Auric Mining | 0.25 | -7% | 4% | -24% | 22% | -26% | $ 37,238,342.75 |
| ENR | Encounter Resources | 0.195 | -7% | -13% | -47% | -24% | -40% | $ 99,758,463.80 |
| SNG | Siren Gold | 0.05 | -4% | -11% | -41% | -14% | -23% | $ 9,853,677.41 |
| STN | Saturn Metals | 0.26 | 18% | 30% | -4% | 30% | 27% | $ 92,847,864.96 |
| USL | Unico Silver Limited | 0.22 | -4% | 13% | -4% | 26% | 13% | $ 98,537,344.88 |
| PNM | Pacific Nickel Mines | 0.024 | 0% | 0% | 0% | -33% | 0% | $ 10,103,834.52 |
| AYM | Australia United Min | 0.002 | 0% | -33% | 0% | -33% | -50% | $ 3,685,154.97 |
| ANL | Amani Gold Ltd | 0 | -100% | -100% | -100% | -100% | -100% | $ 21,449,587.12 |
| HAV | Havilah Resources | 0.175 | -5% | -15% | -17% | -24% | -22% | $ 57,673,570.32 |
| SPR | Spartan Resources | 2.1 | 10% | 39% | 68% | 255% | 49% | $ 2,627,209,445.15 |
| PNT | Panthermetalsltd | 0.014 | -18% | -7% | -46% | -39% | 27% | $ 4,212,663.67 |
| MEK | Meeka Metals Limited | 0.1625 | 2% | 20% | 158% | 364% | 111% | $ 402,362,827.20 |
| GMD | Genesis Minerals | 4 | 8% | 25% | 97% | 106% | 62% | $ 4,405,801,647.00 |
| PGO | Pacgold | 0.06 | -14% | -5% | -37% | -65% | -20% | $ 7,755,805.94 |
| FEG | Far East Gold | 0.12 | -23% | -29% | -37% | -27% | -33% | $ 44,043,294.36 |
| MI6 | Minerals260Limited | 0.12 | -8% | -8% | -14% | -20% | -8% | $ 237,743,333.30 |
| IGO | IGO Limited | 3.48 | -1% | -9% | -36% | -54% | -27% | $ 2,665,582,701.76 |
| GAL | Galileo Mining Ltd | 0.115 | -4% | -18% | -15% | -53% | -8% | $ 21,738,741.97 |
| RXL | Rox Resources | 0.395 | 5% | 41% | 243% | 81% | 98% | $ 213,189,272.80 |
| PTN | Patronus Resources | 0.058 | -13% | -5% | 7% | -31% | 18% | $ 98,243,868.24 |
| CLZ | Classic Min Ltd | 0.001 | 0% | 0% | 0% | -90% | 0% | $ 1,544,025.56 |
| TGM | Theta Gold Mines Ltd | 0.14 | 0% | -3% | -18% | -20% | -22% | $ 118,722,864.51 |
| FAL | Falconmetalsltd | 0.105 | -5% | -5% | -32% | -22% | -9% | $ 19,470,000.00 |
| SPD | Southernpalladium | 0.3 | -21% | -25% | -38% | -34% | -50% | $ 27,285,000.00 |
| ORN | Orion Minerals Ltd | 0.0135 | -16% | -16% | -29% | -4% | -10% | $ 92,481,045.54 |
| TMB | Tambourahmetals | 0.027 | -10% | -10% | -25% | -62% | 29% | $ 3,174,931.24 |
| TMS | Tennant Minerals Ltd | 0.011 | 10% | -31% | -21% | -59% | 22% | $ 11,470,684.98 |
| AZY | Antipa Minerals Ltd | 0.4775 | 4% | 27% | 91% | 298% | 84% | $ 252,061,814.40 |
| PXX | Polarx Limited | 0.009 | 29% | 29% | 13% | -36% | 38% | $ 16,628,506.85 |
| TRE | Toubani Res Ltd | 0.235 | -2% | 62% | -11% | 124% | 38% | $ 50,371,190.98 |
| AUN | Aurumin | 0.056 | -8% | -14% | 12% | 27% | -15% | $ 28,172,828.21 |
| GPR | Geopacific Resources | 0.02 | -5% | 0% | -18% | -26% | 0% | $ 63,649,306.52 |
| FXG | Felix Gold Limited | 0.135 | -10% | -7% | 48% | 170% | 61% | $ 44,402,362.11 |
| ILT | Iltani Resources Lim | 0.22 | 2% | -6% | -6% | 29% | 7% | $ 9,539,043.89 |
| BRX | Belararoxlimited | 0.16 | -16% | 67% | -44% | -41% | -9% | $ 26,608,800.18 |
| TM1 | Terra Metals Limited | 0.029 | 61% | 32% | -29% | -53% | 4% | $ 12,229,051.86 |
| TOR | Torque Met | 0.08 | -17% | -13% | 4% | -45% | 51% | $ 21,573,114.08 |
| ARD | Argent Minerals | 0.022 | -4% | 16% | 22% | 29% | 29% | $ 30,358,450.08 |
| LM1 | Leeuwin Metals Ltd | 0.17 | 31% | 36% | 110% | 143% | 21% | $ 20,161,276.80 |
| SX2 | Southgold Consol | 4.89 | 2% | 36% | 0% | 0% | 0% | $ 546,206,465.31 |
Alice Queen's main game is the Viani project, located on the island of Vanua Levu in Fiji, where in late March the company confirmed the continuity of high-grade epithermal gold at the Dakuniba prospect from surface to a depth of 175m.
The first diamond hole at the prospect, mapped over 3km of low-sulphidation epithermal gold mineralisation, returned intersected several zones from 103.5 to 166.88m including 1.25m grading 2.24g/t gold and 12.48g/t silver from 107.9m and 1.9m at 8.52g/t gold and 13.1g/t silver from 144.2m.
A follow-up hole proved the depth continuity of this zone 80m deeper after returning a top assay of 4.14m at 6.13g/t gold and 9.42g/t silver from 195.76m, including 0.58m at 26.4g/t gold and 39.7g/t silver and 0.80m at 11.4g/t gold and 6.52g/t silver.
Assays are awaited for a third diamond hole that is testing another 100m below that, with drilling and other exploration works planned elsewhere at the Sabeto project in Fiji.
Alice Queen also boast over 500,000oz of gold resources at its Horn Island project in Queensland and two exploration projects in NSW's Lachlan Fold Belt.
Leeuwin Metals surged in the past week after securing a deal to acquire Ramelius Resources' (ASX:RMS) Marda gold project.
It's already got a host of intercepts outside of mined areas for LM1 to follow up, with the mine – previously a satellite for RMS' mothballed Edna May gold mine – not passing the disclosure muster in the warehouse of the $3bn gold miner.
With Leeuwin counting Marda as its main game, the 120km project 120km north of Southern Cross will get the love and attention it deserves.
Leeuwin shares rose around 60% over five trading days to Thursday, and remain 120% higher over the past six months despite a Friday blow off.
Among the observers keenly watching LM1's progress is Lowell Resources Fund CIO and Ten Bagger expert John Forwood.
See his thoughts on the explorer below.
READ: Ten Bagger: The tailwinds for gold miners keep gathering pace
At Stockhead, we tell it like it is. While Alice Queen and Leeuwin Metals are Stockhead advertisers, they did not sponsor this article.
Originally published as Gold Digger: Gold is cool in a crisis and the history books prove it

Is antimony’s sell-off overdone?
Antimony stocks weren’t saved from the recent market carnage. But prices are at all time highs and advanced players are now looking cheap.

Seven reasons why everything will be OK
In the spirit of hopeless optimism, here are seven reasons why Australia could fare well in the redux world of tariff protectionism.