
‘What the hell happened?’: The year Australian house prices broke
“What the hell happened in 2001?” It’s a question many Aussies struggling with the housing crisis are rightly asking.

Economy
Don't miss out on the headlines from Economy. Followed categories will be added to My News.
“What the hell happened in 2001?”
It’s a question many young Australians struggling to get a foot on the housing ladder are beginning to ask themselves, with good reason.
At around the turn of the century, a fundamental shift occurred in the Australian economy — house prices, which had always more or less correlated with incomes, suddenly began to grow at a much faster rate relative to people’s pay packets.
The visual is stark.
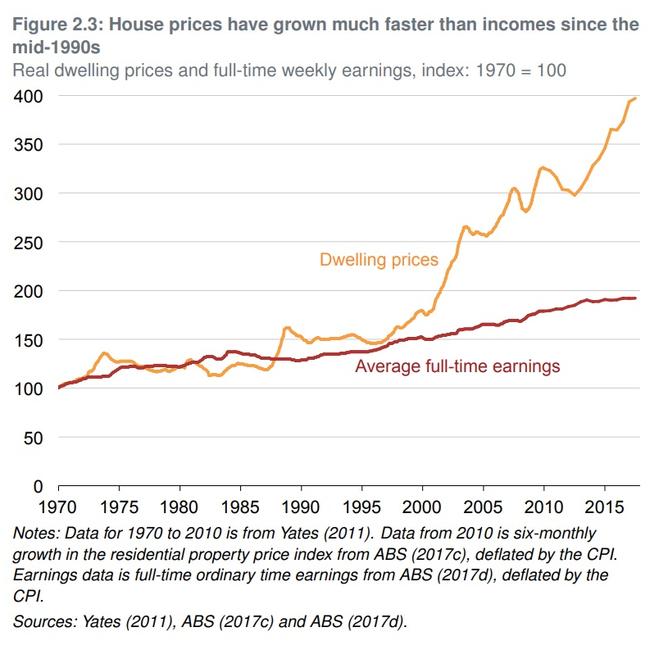
“You could show this to most boomers and they still wouldn’t understand,” wrote one social media user after a graph comparing dwelling prices with full-time earnings was shared in a financial forum.
Another said, “We paid a whopping 18 per cent [interest] on our $10,000 loan for a whole few months. House is now worth $2 million but that’s because we’re savvy investors.”
Fast-forward to today, and the country is facing a housing affordability nightmare.
Despite five interest rate hikes by the Reserve Bank in 2023, house prices rose another 5.52 per cent over the year, further pushing the Australian dream out of reach for ordinary workers.
At the same time the country faces a rental crisis, with record low capital city vacancy rates of around 1 per cent and tenants copping rent increases as high as 50 per cent.
Highlighting the scale of the problem for first homebuyers, research late last year revealed Australians now need to earn more than $300,000 a year to comfortably afford to buy their own home.
Suburbtrends analysed more than 22,000 property sales in 2023, finding median house prices were nine times household incomes — triple the so-called “median multiple” of 3.0 generally considered to be “affordable”.
Kent Lardner, founder and chief analyst at Suburbtrends, told Nine News the research showed home ownership was becoming out of reach for the average Australian.
“The bank of mum and dad is great if you’re from the right parents,” Mr Lardner said.
“But if you don’t have access because you were born in the wrong postcode, or don’t have wealthy parents, then you’re increasingly being locked out entirely. Because if you move into the rental market, good luck trying to save a deposit while you’re spending 31 per cent or more of your household income on rent.”
The report found the median income required to buy a home on Sydney’s northern beaches was $600,000 per year, and still as high as $283,000 in the city’s outer west and Blue Mountains region.
In Melbourne, an income of nearly $429,000 was needed in the city’s inner-east, while buying a home in Brisbane’s south would require $330,000 per year.
And PropTrack found in a September report that a household earning the median income of $105,000 could now only comfortably afford 13 per cent of homes on the market — the lowest share since relevant data was first collected in 1995.
“It is definitely the case that affordability has deteriorated — last year was the worst for affordability in 30 years,” said PropTrack senior economist Paul Ryan.
“A big part of the reason you saw home prices boom from 2001 is that interest rates fell, so it meant someone on a given income could afford much higher prices because borrowing was much cheaper.”
But he suggested charts that simply compare incomes to house prices were “misleading, mainly because home prices are not the same as home costs”.
“What people care about when they’re [trying to afford] a home, if they’re renting it’s how much rent you’re paying relative to your income, and if you’re purchasing a home it’s how much your mortgage repayments are relative to your income,” he said.
PropTrack’s Housing Affordability Index found affordability was toughest in NSW, Tasmania and Victoria, driven by a “dramatic rise in mortgage rates, combined with rising home prices over recent years”.
“At the same time, sharply higher price growth throughout the pandemic has meant housing accessibility — how long it takes new buyers to save a deposit — remains incredibly challenging,” it said.
What happened in 2001
A number of supply and demand factors have long been identified as contributing to the rapid disconnect between house prices and incomes starting in the early 2000s.
Demand-side factors included increased migration, low interest rates, capital gains and negative gearing tax concessions, and rising household incomes — including because of the rise in dual-income households.
All of those demand-side factors “are relevant”, said Joey Moloney, deputy economic policy program director at the Grattan Institute.
“Migration rates increased in the 2000s, and there’s no getting around the fact that more people means we need more homes,” he said.
“Household incomes grew — including because of the rise of dual-income households — and the more money people have the more housing they want to buy. Interest rates fell pretty dramatically over the last few decades. This makes people comfortable borrowing more, and banks more comfortable lending it to them. Naturally this feeds through to prices.”
Mr Moloney added that while capital gains tax and negative gearing “definitely do inflate the demand for housing by providing generous tax treatment for investors … we shouldn’t overstate their impact”.
The Grattan Institute has previously estimated that their effect on property prices is “only in the order of 2 per cent or so”.
According to Mr Ryan, PropTrack’s Affordability Index gives a more accurate picture than simply comparing prices to incomes.
“We looked at households across the income spectrum and calculated how many homes that sold they year they could afford — that’s what people care about,” he said.
“Our index shows affordability got worse over the early 2000s until the GFC, then things slowly got easier because interest rates started to fall again. Whereas if you just look at the chart you see prices increasing. Around the Covid pandemic, when rates were at record lows, was really the best time for affordability since the early 2000s.”
Mr Moloney said the key point was that all of the demand drivers that contributed to the post-2000 boom in prices “would have mattered less if supply were more responsive”.
“Quickly rising house prices tell us we need more houses, particularly in our inner cities,” he said. “That’s really where we’ve fallen short — it’s just been too hard to build more homes where people want to live.”
He noted Australian cities “are some of the least dense in the developed world, and there is no real path to housing affordability that doesn’t involve our cities becoming denser”.
“This means reforming land-use planning rules so it’s easier to build medium-density in desirable inner-city suburbs, close to jobs and transport,” he said.
He said governments — such as NSW, where some 45,000 new homes are expected to be built within four years after the rezoning of land around eight train stations — were “starting to move in the right direction, but there’s still a lot more to do”.
Mr Ryan also stressed supply-side factors shouldn’t be ignored.
While interest rates are “overwhelmingly the biggest influence on housing affordability … other things matter”.
He pointed to Tasmania, which went from being one of the more affordable states a decade ago to the second least affordable because it failed to keep up. House prices in Hobart are now around $670,000, overtaking Perth and around the same level as Adelaide.
“Tasmania saw a huge demand boom, Hobart has constrained geography with the mountain and river, and it didn’t respond quickly enough to upzone and build homes,” he said.
Smashed avo ‘myth’
The divide between baby boomers and younger generations over housing affordability has grown in recent years.
Australia experienced periods of very high interest rates in the 1980s and 1990s relative to the past decade — famously peaking at 17.5 per cent in 1990 — a fact often raised by older generations.
“I was a single parent and my mortgage was 18 per cent,” one talkback radio caller told 3AW last year.
“I didn’t go out when my friends were socialising, I didn’t get cappuccinos, I didn’t go out for breakfast, I scrimped and scraped and I worked hard, and that’s the only way you can do it. I mean, I know they disagree and say, oh we have to have a life as well now, but if you want to save the money and get a deposit then you need to cut back on these things.”
But house prices 40 years ago were also vastly lower, both in real terms and relative to incomes, meaning older generations didn’t have to borrow as much.
“I think we’ve created a group of people that, for the first time, certainly postmodern, have a worse quality of life than the generation before them,” landlord baby boomer Gregory Leech, who has two gen Z children, told SBS Insight last year.
“I don’t think there’s enough smashed avocado on the planet to allow you to save up for house. Yes, they do like nice things but this myth that kids are out there eating too much avocado and buying plasma screens and all that sort of stuff. There’s a little bit of that, but I don’t think it’s at all the problem that people say it is.”
Do you have a story? Email tips@news.com.au
‘High migration country’
Australia brought in a record half a million migrants in 2022-23, sparking growing calls to reduce the numbers to allow housing supply to catch up.
Economist Chris Richardson told QandA in November the easiest way would be to temporarily cut back on the number of international students, who made up the bulk of the 518,000 net overseas arrivals last year.
AMP head of investment strategy and chief economist Shane Oliver has also previously called for lower immigration to address housing affordability, saying “the role of high immigration levels can’t be ignored”.
“On our estimates it needs to be cut back to nearer 200,000 people a year to better line up with building industry capacity and to reduce the chronic housing supply shortfall,” he said in a September note.
“The main problem is nations like Australia and Canada run extraordinarily large immigration programs that are well beyond their ability to supply homes and infrastructure,” MacroBusiness chief economist Leith van Onselen said last week.
“These extreme immigration programs have created chronic housing shortages in both nations. So, the real solution to the housing crisis is to significantly lower immigration so housing and infrastructure can keep pace with population growth.”
But Mr Ryan argued that while migration had “definitely been a component of housing demand”, the “emphasis on immigration has been a little too strong relative to its impact on housing affordability more broadly”.
“We’re really seeing strong net immigration now because we’re not seeing the outflows [we normally would], because no one entered the country during Covid,” he said.
“We have been a high migration country for several decades now, before the pandemic we had a long period of flat rents while we had strong migration. Migration is one component of housing demand, but it wouldn’t even be close to the biggest driver of housing affordability compared to mortgage rates.”


Originally published as ‘What the hell happened?’: The year Australian house prices broke
ASX marks second best close on record
The Australian sharemarket closed just off a record high on Thursday, as renewed optimism in the US-China relationship, spurred a rally in key stocks.

Coles slammed over mass product cull
Nationals leader David Littleproud has hit out at Coles after the supermarket giant flagged a cull in its product range, claiming prices at the checkout would rise.