
Interactive map: Regional Australia’s worst roads revealed
Two thirds of Australia’s road deaths and hospitalisations occur regionally. Now drivers can use this map to flag areas they want fixed.
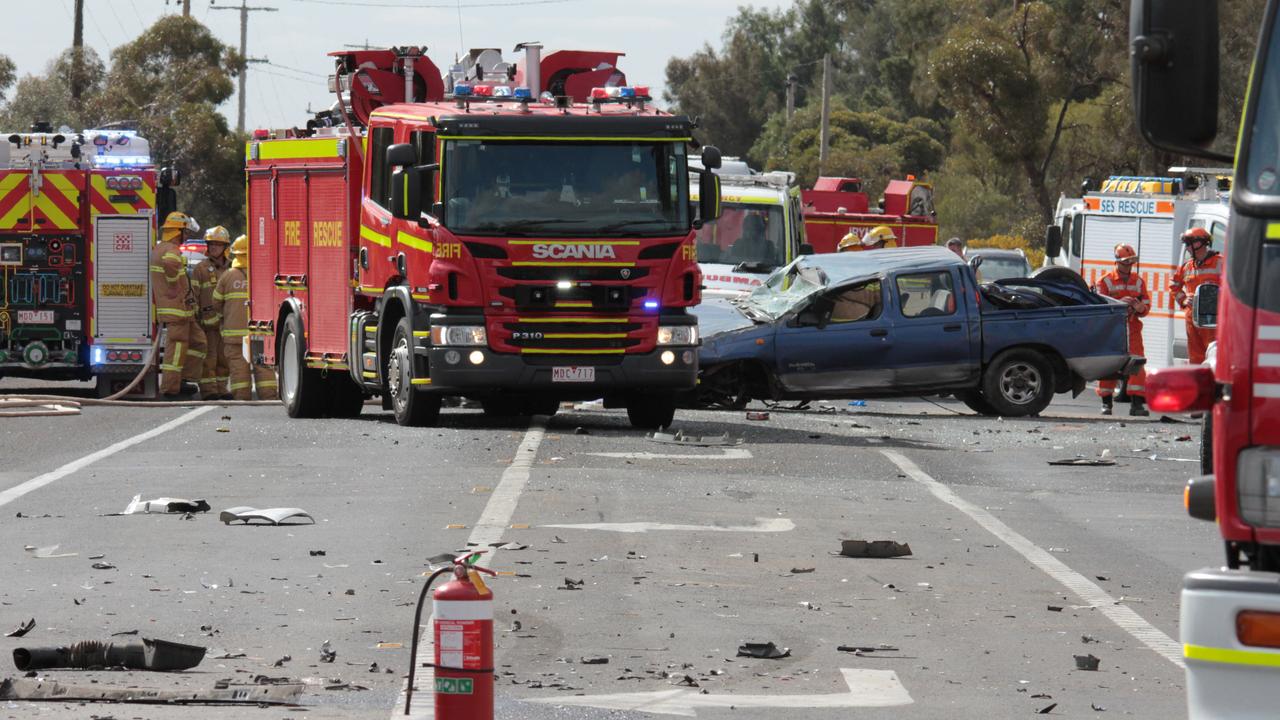
Regional Australians are being left behind in the national campaign to bring road fatalities “Towards Zero”.
The nation’s peak road safety research body, the Australian Road Research Board, has warned that without addressing road safety in rural areas, the nation will never be able to achieve zero deaths.
Federal Parliament’s Joint Select Committee on Road Safety reported the annual loss of lives on Australian roads averaged 1200, with another 36,000 hospitalised, of which two-thirds occurred in regional areas.
Tragically the gap between country and city is widening.
State-based road safety and accident commission statistics show the urban road toll is falling at a much faster rate than in the regions, as vast sums are poured into multibillion-dollar metropolitan freeways, level crossing removals, intersection upgrades, road widening and tunnels.
Victoria’s Traffic Accident Commission figures show greater metropolitan Melbourne’s road fatalities have fallen by 47 per cent since 2000, from 225 to 120 in 2019.
But in regional Victoria fatalities have fallen by less than 20 per cent over the same period, from 182 to 146.
Even during the 2020 COVID lockdown 126 lives were lost on regional roads, while metro Melbourne’s toll fell to 85.
It’s a similar story in other states, with Transport for NSW data, dating back to 1996, showing Sydney’s toll had dropped by 58 per cent by 2019, from 284 to 119, while the state’s regional toll fell 21 per cent, from 297 to 234 in that time.
ARRB has brought all state and territory road crash data together in a single map to help the public, local councils and other government agencies identify high risk areas and solutions to the problem.
Zooming in on local government areas shows a scatter of red triangles representing fatalities, of which many are on highways and arterial roads where drivers have simply run off the road or died in head-on collisions.
Clicking on each red triangle delivers a pop-up profile of the road crash, showing the crash type, age, gender, speed zone and date of the incident.

CLICK HERE FOR INTERACTIVE CRASH MAP
ARRB engineer Tia Gaffney said many municipal councils were struggling to resolve head-on collisions and run-off-road accidents, given many roads lacked the width and shoulders needed to separate traffic with barriers or give drivers a greater margin of error.
“In a lot of regional areas you don’t have the road width to deal with and there’s not the financial ability to do it (widening or lane separation),” Ms Gaffney said.
On the outskirts of regional towns the ARRB’s crash map showed it was deadly T-bone accidents that were taking lives, where major 100km/h roads intersect with local roads.
Ms Gaffney said the ARRB wanted regional Australians and councils to use the crash map to not only identify dangerous zones or intersections, but to give feedback on what they thought were the most dangerous hot spots, plus what could be done to make them safer.
Within regional towns the crash map shows clusters of purple dots representing major non-fatal accidents, where victims have been hospitalised, plus minor accidents represented by mauve dots.
Councils are trying to use roundabouts, road narrowing and long platform speed humps to slow intersection traffic.
But given local councils collect just 3.3 per cent of $559 billion collected by all levels of government in rates, taxes and duties, they rely on federal and state funding to bridge the urban-regional road safety gap.
Last October the Federal Government announced a one-off allocation of $2 billion towards a national road safety program, with no commitment to more beyond June 30 next year.
In contrast, Federal and state governments are pouring tens of billions of dollars into urban road infrastructure.
In Melbourne the Victorian Government is on track to spend $14.8 billion removing 75 level crossings to curb crashes and ease congestion.
Other jointly funded urban projects include:
$1 billion on completing the upgrade of Melbourne’s M80 Ring Road
$1.4 billion on upgrading Melbourne’s Monash Freeway
$16.8 billion to deliver the WestConnex project, linking western and southwestern Sydney with the city in partnership with the NSW Government.
$3 billion North Connex construction of dual road tunnels
$4.5 billion for Adelaide’s North-South Corridor
$1.1 billion on the Gateway Motorway, a primary connection between the Bruce Highway, industrial/commercial precincts in northern Brisbane and the Australia TradeCoast and export markets via Port of Brisbane and Brisbane Airport
$1 billion on NorthLink WA to provide a new transport link between Morley and Muchea.
Victorian Department of Transport chief regional roads officer Paul Northey said “tragically, regional roads are over-represented in the road toll with excessive speed and fatigue major factors in fatal road crashes in regional Victoria last year”.
“Some motorists are still choosing to ignore speed limits, drive under the influence of alcohol or drugs – and that’s costing lives.
“Our crews are out on the network installing safety upgrades along thousands of kilometres roads to prevent dangerous head-on and run-off-road crashes – the single biggest cause of death on regional roads.
“More than 100 road safety projects are also rolling out across Victoria at the moment, in a $245 million road improvement blitz designed to reduce road trauma and save lives also funded by the State and Federal Governments.
“One death on our roads is one too many – that is why we are doing everything we can to reduce road trauma and save lives through the Victorian Road Safety Strategy 2021-2030.”
MORE
BACK ROAD SUGGESTED BY GOOGLE CLAIMS FOUR LIVES IN SIX YEARS
Join the conversation

Why Ley vows to fight Labor ‘every step of the way’ on tax
Opposition leader Sussan Ley has shrugged off dire polling for the Coalition and vowed to fight Labor “every step of the way” on tax.
Read more

‘Planned murder’: New evidence found in Bali shooting probe
Indonesian police have alleged the murder of Australian man Zivan Radmanovic in Bali was premeditated and that a second gun was found in a drain using a metal detector.
Read more