
Farming footprint: Just how much of Australia is devoted to ag?
A recently produced ABARES map shows Australian agriculture is a diverse beast spread across a vast nation, producing enough to feed more than twice our national population.

IF THERE is one positive to come out of 2020, it is that Australians actually took note of where their food came from.
Bushfire, quickly followed by an enduring pandemic, has shone a light on how much food is produced within our borders – and on the farmers who ensure that supply is secure.
So it is timely that a national map showing the major agricultural regions by commodity has been produced.
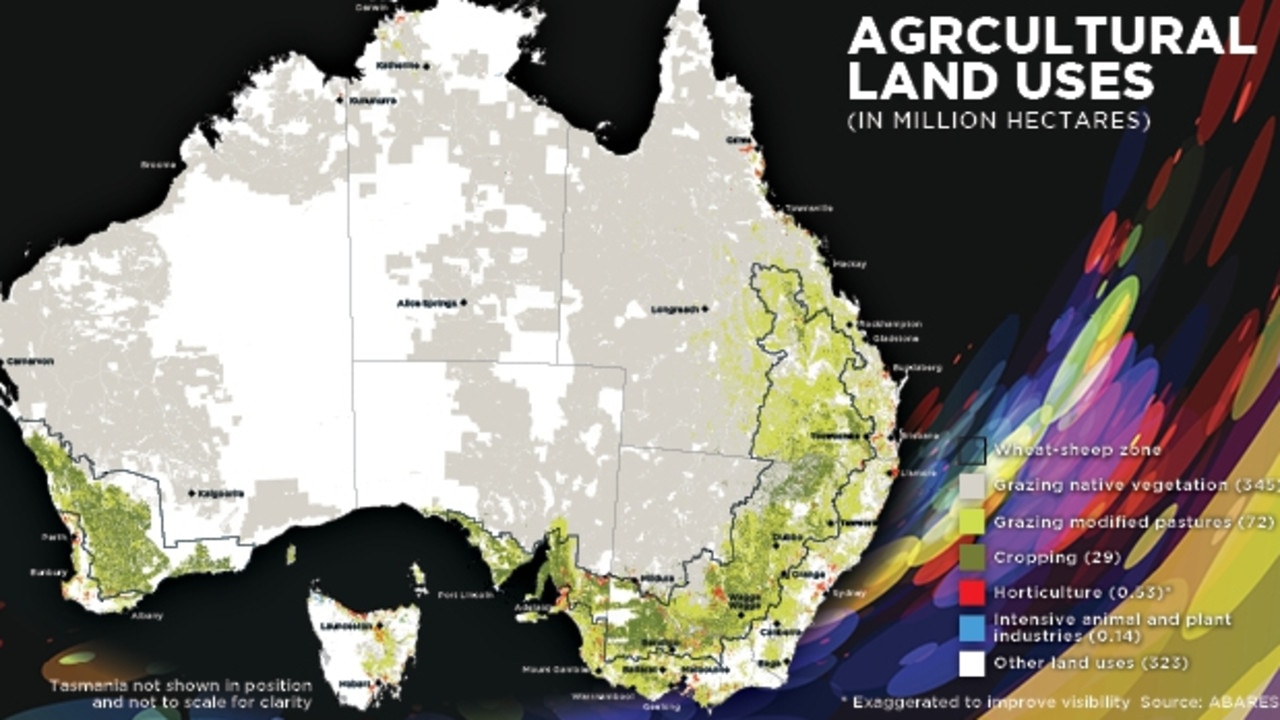
The first thing that hits you is the enormity of our grazing sector. The map, compiled by the Australian Bureau of Agricultural and Resource Economics and Sciences, shows grazing of native vegetation accounts for 45 per cent of all agricultural land use, while grazing modified pastures encompasses just 9 per cent.
And despite the popular image of vast wheatfields stretched as far as the eye can see, only about 4 per cent of Australia’s agricultural land is devoted to cropping.
As the map shows, much of that grain production is concentrated in Victoria’s Mallee Region, South Australia’s Yorke and Eyre Peninsulas, and the famed wheat belt of Western Australia.
The map highlights the nation’s wheat-sheep zone, which encompasses those grain-growing regions. This highlights the complementary nature of sheep grazing with crop production, a feature of Australian farming since European settlement.
A distinctive feature of the map is red splotches that signify horticulture production. Horticulture, encompassing less than 1 per cent of all agricultural land use, clusters around rivers and coastlines with ample water. Horticulture on the map can roughly be split into three arms. The first is the vegetable-growing hot spots close to major cities. Melbourne and Sydney are virtually ringed by vegetable farms. Then there are the fruit and nut growing regions, seen most clearly around Mildura, Cairns and Lismore.
And finally, the distinctive red of grape production in the premier wine regions.
NSW’s Hunter Valley and Riverina around Griffith, South Australia’s Barossa Valley, Clare Valley and Adelaide Hills, Western Australia’s Margaret River and the Yarra Valley in Victoria are clearly identified on the map.
Another feature is the smattering of intensive animal and plant industries, signified by blue in the Northern Territory and northwest Tasmania. ABARES says the blue regions in Tasmania represents intensive vegetables, grapes and berries, while the blue in the Northern Territory includes the fruit and nuts, particularly melons, bananas and mangoes, along with some vegetables.
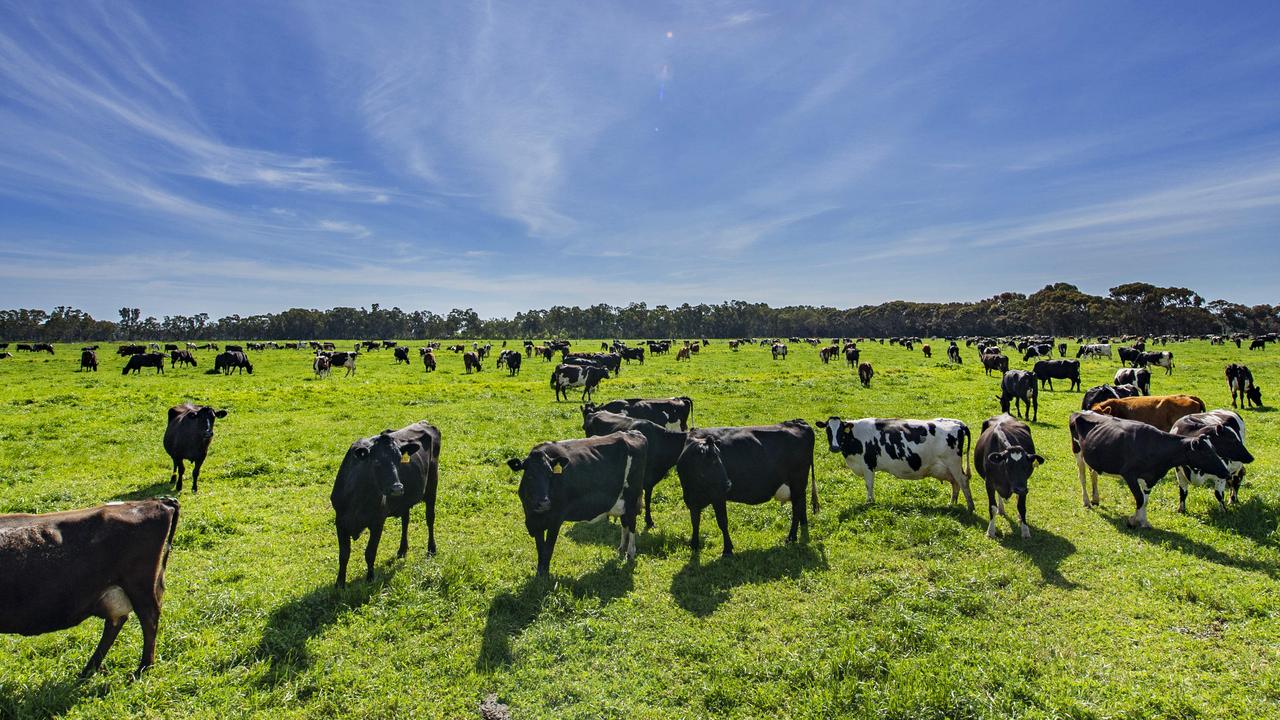
What you won’t see in the map is Australia’s dairy regions, as they are encompassed into the grazing areas. If it did you would see a concentration in Victoria’s Gippsland, southwest and Murray region, where more than 60 per cent of the nation’s milk is produced.
In total, the area devoted to farming covers 58 per cent of Australia’s landscape and is farmed by just 2 per cent of employed Australians.

ABARES chief commodity analyst Jared Greenville says despite facing many challenges, Australian agriculture has continued to grow, driven mainly by consumer demand.
“The most striking feature for me is just how much agriculture is ingrained in the Australian landscape across the board,” Dr Greenville says. “The figure of 58 per cent of the continent, and one of the world’s biggest countries, is quite amazing. Our exports have reached broad consumers, that’s really what this shows and highlights.”
The importance of the highly productive nature of Australian agriculture was made clear in March as the nation grappled with the onset of the coronavirus pandemic.
When the virus hit our shores, panic buying swept the nation, as consumers scrambled to stock up on necessities.
And what were the first items to disappear from supermarket shelves?
Aside from toilet paper, shoppers rushed to snap up bags of rice, pasta, and mounds of mince meat, sausages, and red meat, all Australian grown and produced.
But consumers need not have worried about food running out; Australia has one of the most secure food supply chains in the world, as it produces far more food and fibre than the 25-million-head population can possibly consume. In fact, according to the Federal Government, Australia’s farmers produce enough food to feed 60 million people. “The positive is that agriculture is a relatively stable industry amid a volatile economy. People need to eat, and production will largely go ahead regardless of an economy in boom or bust mode,” says Rural Bank regional manager Josie Zilm.
“Despite multiple years of drought and other disasters, the value of agricultural production has remained resilient around $59-$61 billion in the last five years. Our agricultural exports were $50 billion in 2019-20, which is 10.5 per cent of Australia’s $447 billion of good and services exports,” says Zilm.
While Australian agriculture might be a big player in terms of output and production, the amount of people employed in agriculture has declined in the last 30 years. ABARES data shows that in 1989, almost 400,000 people were employed in agriculture in Australia, or about 6 per cent of national employment.
By 2018-19 that was closer to 300,000, or just over 2 per cent of national employment. “Output is going the other way, while employment is falling. It is productivity growth that has underpinned that,” Dr Greenville says.
“It’s really about becoming better and better at producing the food that we do. As time has gone on, we’ve developed new practices, new machines, and have reduced the number of people who need to work.”
MORE
LIVESTOCK PRICES CONTINUE TO RISE. HERE'S WHY.
AUSTRALIAN LAND USE: AGRICULTURE DOMINATES
ZEBRA BURGERS: WHY THIS COMPANY IS EXPLORING EXOTIC FAKE MEAT

