
Tasmania’s worst suburbs for animal cruelty ranked
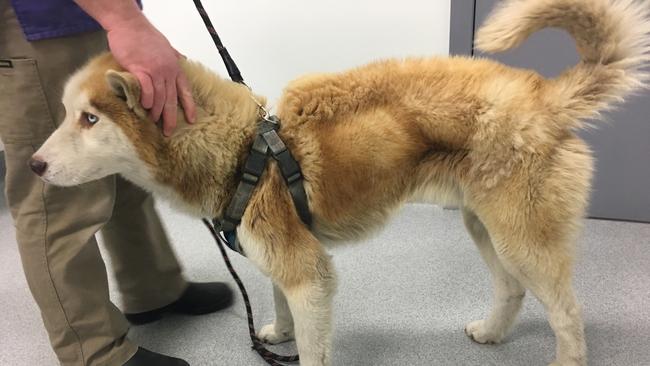
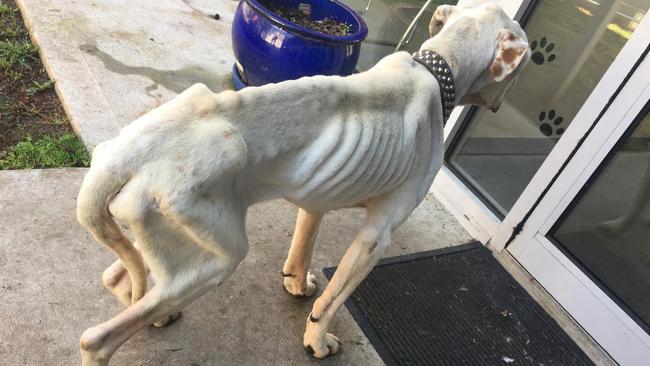
The RSPCA has released data on the suburbs with the highest number of animal cruelty incidents for 2023. See if your suburb has made the shameful list. Distressing content warning.

Tasmania
Don't miss out on the headlines from Tasmania. Followed categories will be added to My News.
Glenorchy, Devonport and Ulverstone were the suburbs with the highest number of animal welfare incidents in the past financial year, new data reveals.
In the 12 month period, 2167 calls were made to the RSPCA hotline, an increase of 149 from the previous reporting period.
There were 113 notices issued and 65 warning letters sent. Seven individuals were charged and are facing a total of 85 charges between them.
There were nine animal cruelty cases finalised in court.
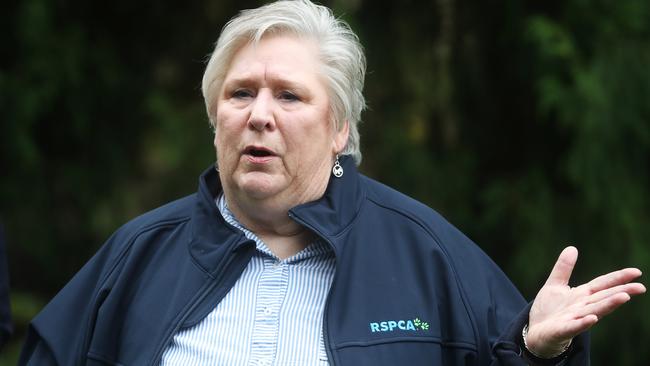
RSPCA Tasmania chief executive Jan Davis said a lot of cases were to related to owners who did not provide adequate care.
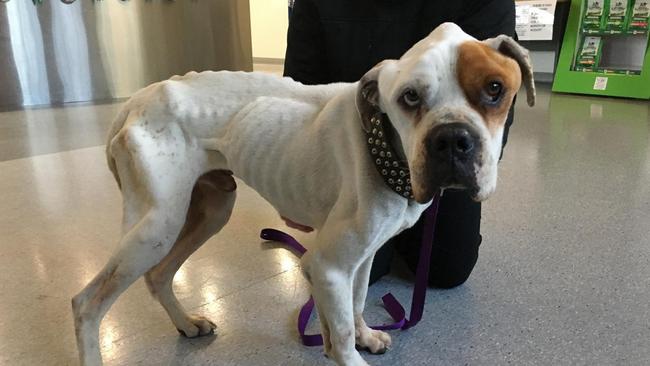
“We’re seeing broader cruelty reports and also surrender reports … most [cruelty reports] are to do with issues under Section 8 of the Animal Cruelty Act, failure to feed, failure to care for,” Ms Davis said.
“It’s basically people who appear to have failed to look after their animal the way they’re supposed to.
“Most of the calls don’t result in charges.”
The RSPCA also revealed which suburbs had the highest number of animal cruelty calls.
Glenorchy topped the list, with 43 complaints made to the hotline, followed by Devonport, which had 30 complaints.
“The results are fairly consistent across the time periods, they’re disappointing in that we would like to be seeing decreases in the rates of animal cruelty reports,” Ms Davis said.
“There’s been a bit of a move, normally we would see Ravenswood and Rocherlea both the top two. Devonport was the highest last year.”
Ms Davis said the results showed calls were more commonly coming from lower socio-economic areas.
“(And) this is not just the case in Tasmania,” she said.
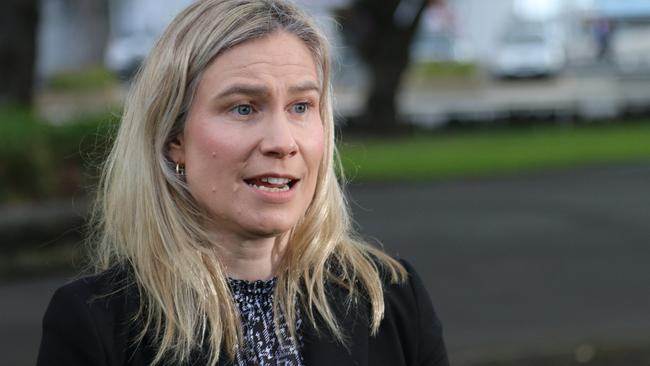
Independent Clark MP Kristie Johnston, whose electorate takes in the city of Glenorchy, said stronger animal welfare laws were needed.
“Tasmanian animal welfare laws and standards desperately need to be strengthened to recognise not only the sentience of animals, but also to be clearer about the standards that would ensure and improve their health and wellbeing,” she said.
“An urgent legislative review of the Animal Welfare Act is required to not only modernise it so it is reflective of current community expectations when it comes to animal welfare but also incorporates the principle that animals are sentient beings.
“However, improvements to legislation and welfare standards will only work if regulators and inspecting authorities are adequately resourced, to not only educate about improved standards, but also enforce them and, where necessary, prosecute.
“They are currently grossly underfunded and therefore are constrained in what they can do.”
Ranked: Tasmania’s worst animal cruelty hot spots
1. Glenorchy
Number of complaints: 43
Change in cruelty complaints since 2022: 43 per cent
Change in hotspot ranking: 1
Population 50,411, cruelty reports per 1000 people: 0.6
2. Devonport
Number of complaints: 30
Change in cruelty complaints since 2022: -21 per cent
Change in hotspot ranking: -1
Population 26,015, cruelty reports per 1000 people: 1.5
3. Ulverstone
Number of complaints: 25
Change in cruelty complaints since 2022: 9 per cent
Change in hotspot ranking: 2
Population 6,653, cruelty reports per 1000 people: 3.5
4. Bridgewater
Number of complaints: 22
Change in cruelty complaints since 2022: -21 per cent
Change in hotspot ranking: -1
Population 4,592, cruelty reports per 1000 people: 6.1
5. Rocherlea
Number of complaints: 22
Change in cruelty complaints since 2022: 120 per cent
Change in hotspot ranking: 20
Population 1,033, cruelty reports per 1000 people: 9.7
6. Shorewell Park
Number of complaints: 21
Change in cruelty complaints since 2022: 17 per cent
Change in hotspot ranking: 5
Population 2,150, cruelty reports per 1000 people: 8.4
7. Mowbray
Number of complaints: 20
Change in cruelty complaints since 2022: 100 per cent
Change in hotspot ranking: 16
Population 4,048, cruelty reports per 1000 people: 2.5
8. Claremont
Number of complaints: 19
Change in cruelty complaints since 2022: -5 per cent
Change in hotspot ranking: 0
Population 8,397, cruelty reports per 1000 people: 2.4
9. George Town
Number of complaints: 19
Change in cruelty complaints since 2022: -14 per cent
Change in hotspot ranking: -3
Population 4,536, cruelty reports per 1000 people: 4.9
10. Ravenswood
Number of complaints: 18
Change in cruelty complaints since 2022: -22 per cent
Change in hotspot ranking: -6
Population 3,804, cruelty reports per 1000 people: 6
11. Risdon Vale
Number of complaints: 16
Change in cruelty complaints since 2022: 78 per cent
Change in hotspot ranking: 18
Population 3,171, cruelty reports per 1000 people: 2.8
12. St Leonards
Number of complaints: 16
Change in cruelty complaints since 2022: 167 per cent
Change in hotspot ranking: 12
Population 2,351, cruelty reports per 1000 people: 2.6
13. Waverley
Number of complaints: 16
Change in cruelty complaints since 2022: 433 per cent
Change in hotspot ranking: 118
Population 1,582, cruelty reports per 1000 people: 1.9
14. East Devonport
Number of complaints: 15
Change in cruelty complaints since 2022: 650 per cent
Change in hotspot ranking: 133
Population 5,075, cruelty reports per 1000 people: 0.4
15. New Norfolk
Number of complaints: 15
Change in cruelty complaints since 2022: -29 per cent
Change in hotspot ranking: -8
Population 6,153, cruelty reports per 1000 people: 3.4
16. Brighton
Number of complaints: 14
Change in cruelty complaints since 2022: 40 per cent
Change in hotspot ranking: 2
Population 4,983, cruelty reports per 1000 people: 2
17. Kingston
Number of complaints: 13
Change in cruelty complaints since 2022: 0 per cent
Change in hotspot ranking: -2
Population 12,288, cruelty reports per 1000 people: 1.1
18. Chigwell
Number of complaints: 12
Change in cruelty complaints since 2022: 300 per cent
Change in hotspot ranking: 87
Population 2,050, cruelty reports per 1000 people: 1.5
19. Clarendon Vale
Number of complaints: 11
Change in cruelty complaints since 2022: 83 per cent
Change in hotspot ranking: 27
Population 1,635, cruelty reports per 1000 people: 3.7
20. Herdsmans Cove
Number of complaints: 11
Change in cruelty complaints since 2022: 83 per cent
Change in hotspot ranking: 29
Population 1,199, cruelty reports per 1000 people: 5
21. Newnham
Number of complaints: 11
Change in cruelty complaints since 2022: 10 per cent
Change in hotspot ranking: 3
Population 7,073, cruelty reports per 1000 people: 1.4
22. Rokeby
Number of complaints: 11
Change in cruelty complaints since 2022: -27 per cent
Change in hotspot ranking: -10
Population 4,211, cruelty reports per 1000 people: 3.6
23. Sandy Bay
Number of complaints: 11
Change in cruelty complaints since 2022: 450 per cent
Change in hotspot ranking: 159
Population 12,326, cruelty reports per 1000 people: 0.2
24. Youngtown
Number of complaints: 11
Change in cruelty complaints since 2022: 10 per cent
Change in hotspot ranking: 2
Population 4,315, cruelty reports per 1000 people: 2.3
25. Beaconsfield
Number of complaints: 10
Change in cruelty complaints since 2022: 19 per cent
Change in hotspot ranking: 19
Population 1,093, cruelty reports per 1000 people: 5.5
26. Launceston
Number of complaints: 10
Change in cruelty complaints since 2022: 0 per cent
Change in hotspot ranking: -6
Population 70,055, cruelty reports per 1000 people: 0.1
27. Westbury
Number of complaints: 10
Change in cruelty complaints since 2022: 43 per cent
Change in hotspot ranking: 16
Population 2,272, cruelty reports per 1000 people: 3.1
28. Epping Forest
Number of complaints: 9
Change in cruelty complaints since 2022: 29 per cent
Change in hotspot ranking: 9
Population 87, cruelty reports per 1000 people: 80.5
29. Geeveston
Number of complaints: 8
Change in cruelty complaints since 2022: 14 per cent
Change in hotspot ranking: 9
Population 1,431, cruelty reports per 1000 people: 4.9


$47m lost: Tasmania’s worst pokie hotspots
Tasmanians are losing more than $47 million as the state’s worst pokies hot spots can be revealed. Search our interactive table and see how your suburb compares.

Not just a lawyer’s picnic: Why Human Rights Act should be priority for Tassie indies
The Australian Lawyers Alliance is calling on Tasmanian Independent MPs to ensure a Human Rights Act is part of any negotiation with the major parties to form government. WHAT IT WOULD MEAN