
REPORT: Drugs lead the way for South Burnett crime data
A deep dive into the last two years of crime in the region has uncovered some staggering statistics.

Police & Courts
Don't miss out on the headlines from Police & Courts. Followed categories will be added to My News.
A DEEP dive into the crime history in the South Burnett has uncovered that drugs continue to be the biggest problem facing police in the region.
Date released by the Queensland Police Service from September 3 2018 – September 2 2020 has provided an insight into the crime trends in the region.
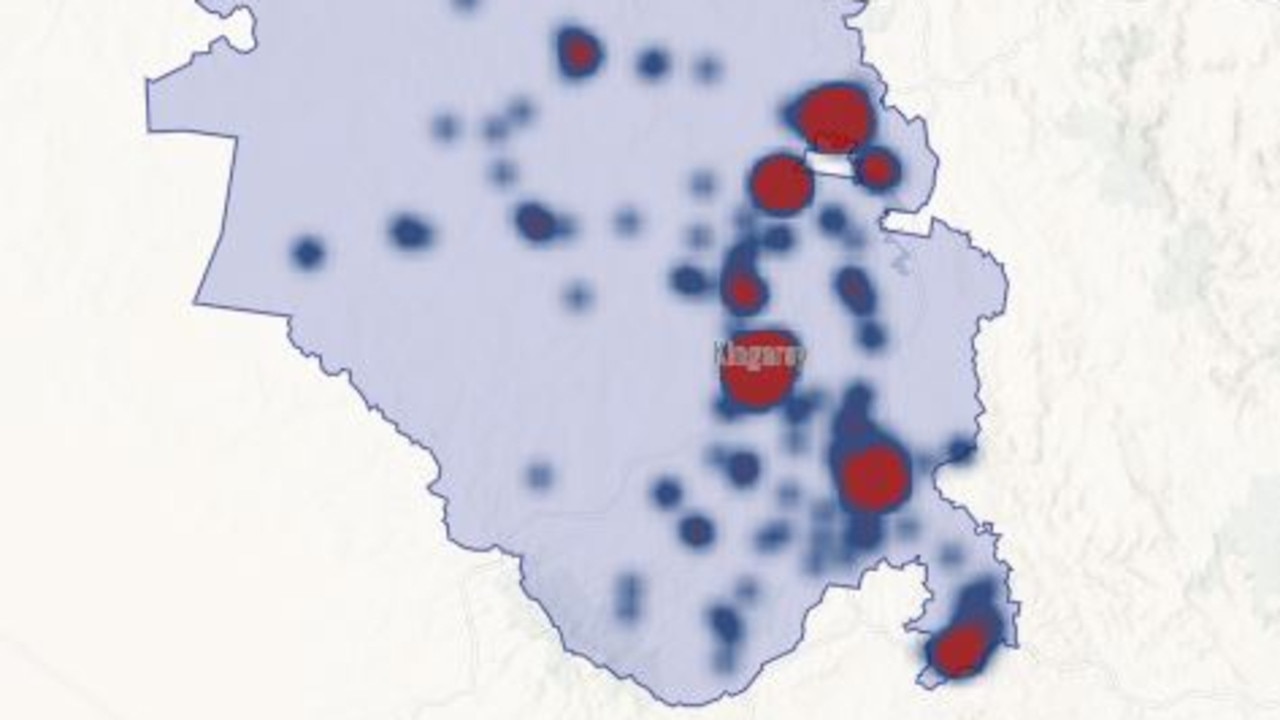
This data covers seven towns in the South Burnett and breaks down the specific crimes into categories.
In total the South Burnett had 7458 offences over the last two years with with 1788 drug related offences.
Traffic related offences were also high on the crime list with 976 offences followed by 816 good order offences.
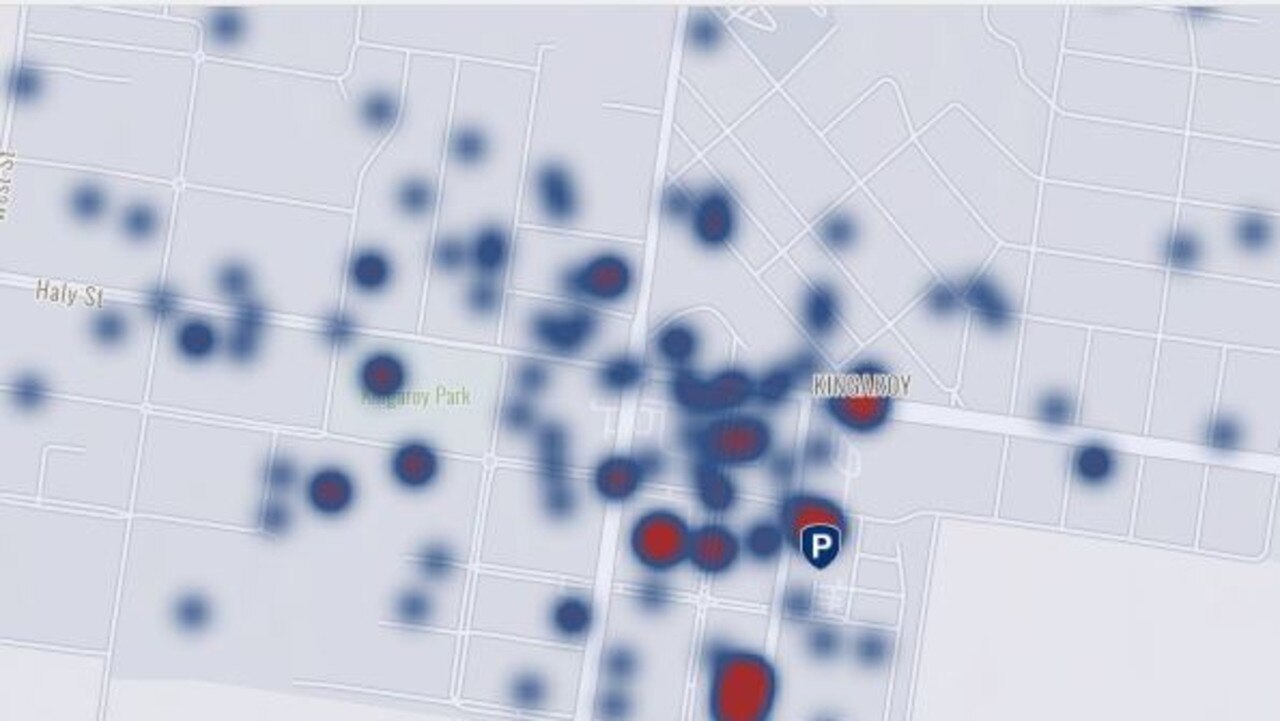
Kingaroy topped the table for crime, with 3166 offences occurring over the past two years, 872 of those were drug offences, 503 theft offences and 461 traffic offences.
October 2018 was the worst month for offending with 190 offences occurring in Kingaroy.
Saturday proved to be the busiest day for offending with 485 crimes occurring in Kingaroy, majority of them occurring around midnight.
The Murgon police zone was the second highest area of crime in the region.
In total there were 1852 crimes committed, 322 of those drug related, 322 theft offences and 291 good order offences.
October 2019 was the highest month of crime in Murgon, with 118 offences in total.
Friday was the biggest day for crime in Murgon, with a total of 310 crimes occurring on that day over the course of two years.
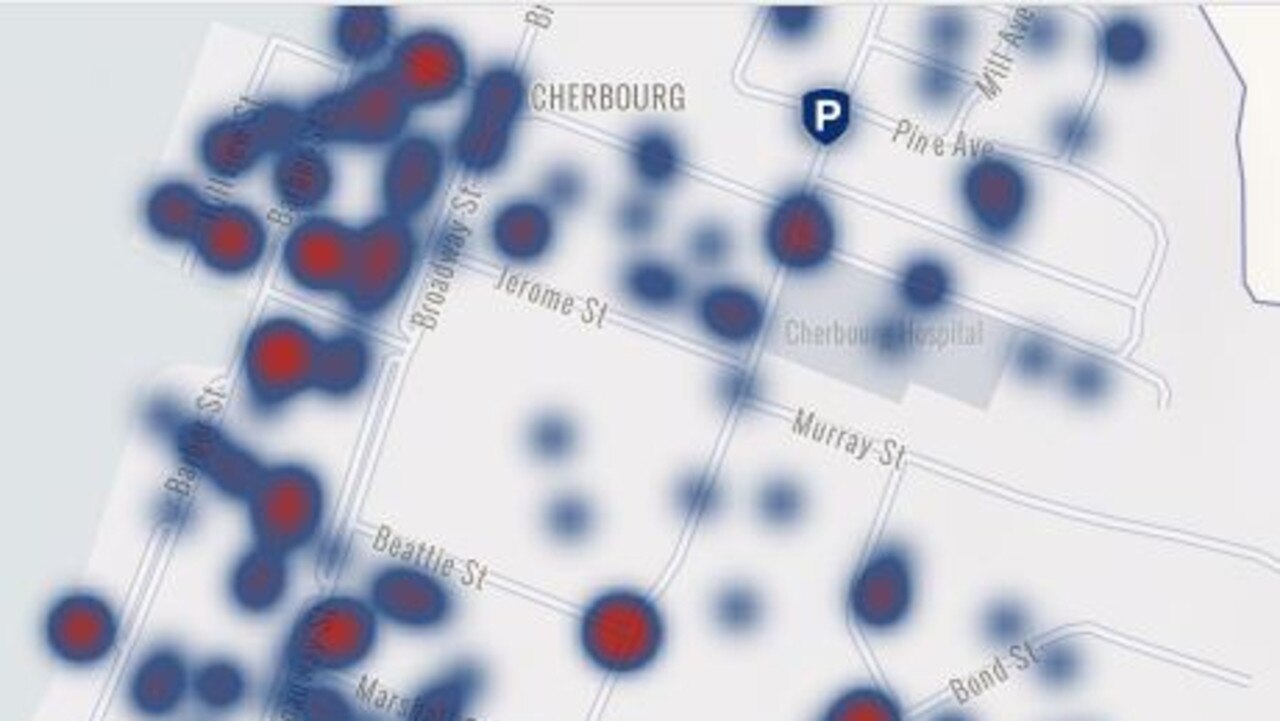
Cherbourg was the town with the third highest number of crimes, 1374 in total.
Good order offences topped the table at 255 offences, followed by assault 235 and property damage 216.
July 2020 had the most offences with 89 offences taking place in that month.
Saturday was again the pick of the week for criminals with 263 crimes taking place over the course of two years.
The remaining towns are as follows:
Nanango – 889
Drug offences – 167
Theft – 160
Traffic related offences – 135
Wondai – 483
Drug offences – 113
Traffic related offences – 80
Unlawful entry 61
Blackbutt – 433
Drug offences – 138
Traffic offences – 85
Theft – 59
Yarraman – 298
Traffic offences – 74
Drug offences – 61
Theft – 62

Everybody appearing at Kingaroy Magistrates Court, Wednesday, May 28
Here is a list of matters listed at Kingaroy Magistrates Court on Wednesday.
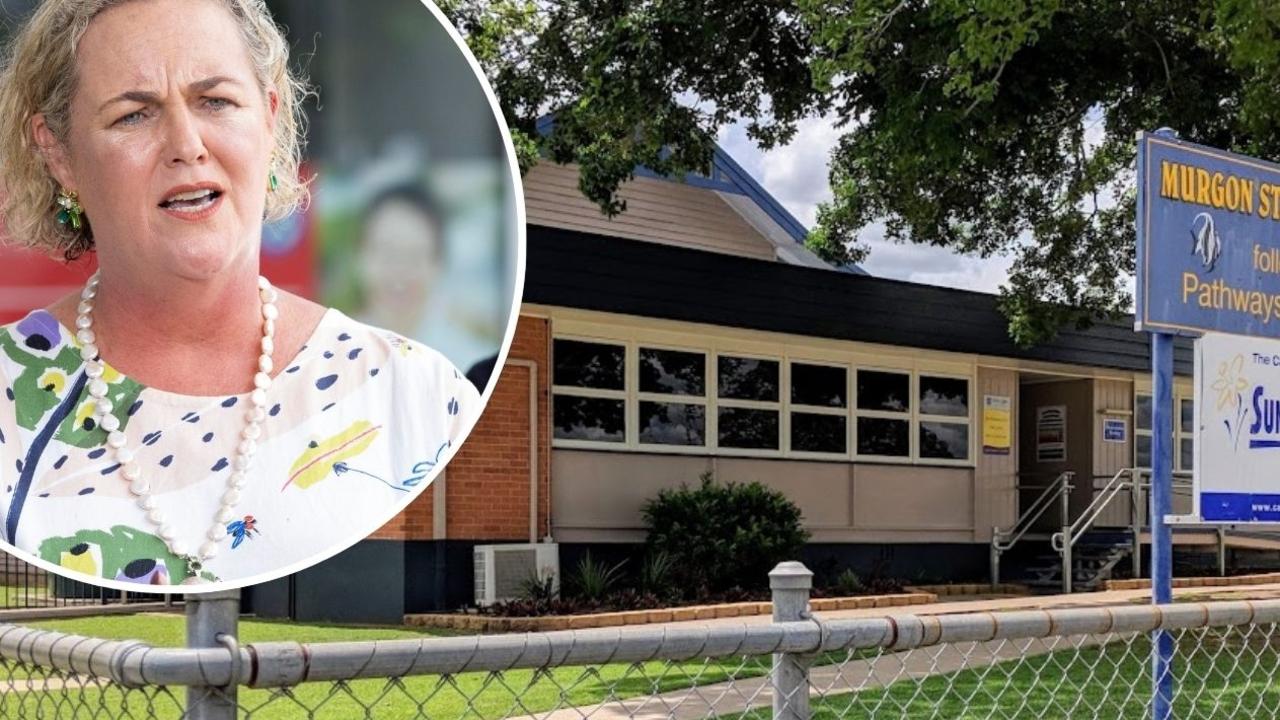
Parent charged after principal allegedly bashed on school grounds
The mother of a student at a regional primary school will face court after the principal, a grandmother, was allegedly attacked on school grounds.
Daughter’s campaign to find truth about mum’s violent death
A woman searching for answers about the death of her mother 45 years ago took Facebook posts about her campaign too far, landing her in court. See why

New details revealed as coroner narrows focus in boy’s tragic death
A coroner has ruled against the family’s request to broaden the inquest into the death of a young boy from a brown snake, as sad new details are revealed about his home life.
Everybody appearing at Kingaroy Magistrates Court, Monday, May 26
Here is a list of matters listed at Kingaroy Magistrates Court on Monday.
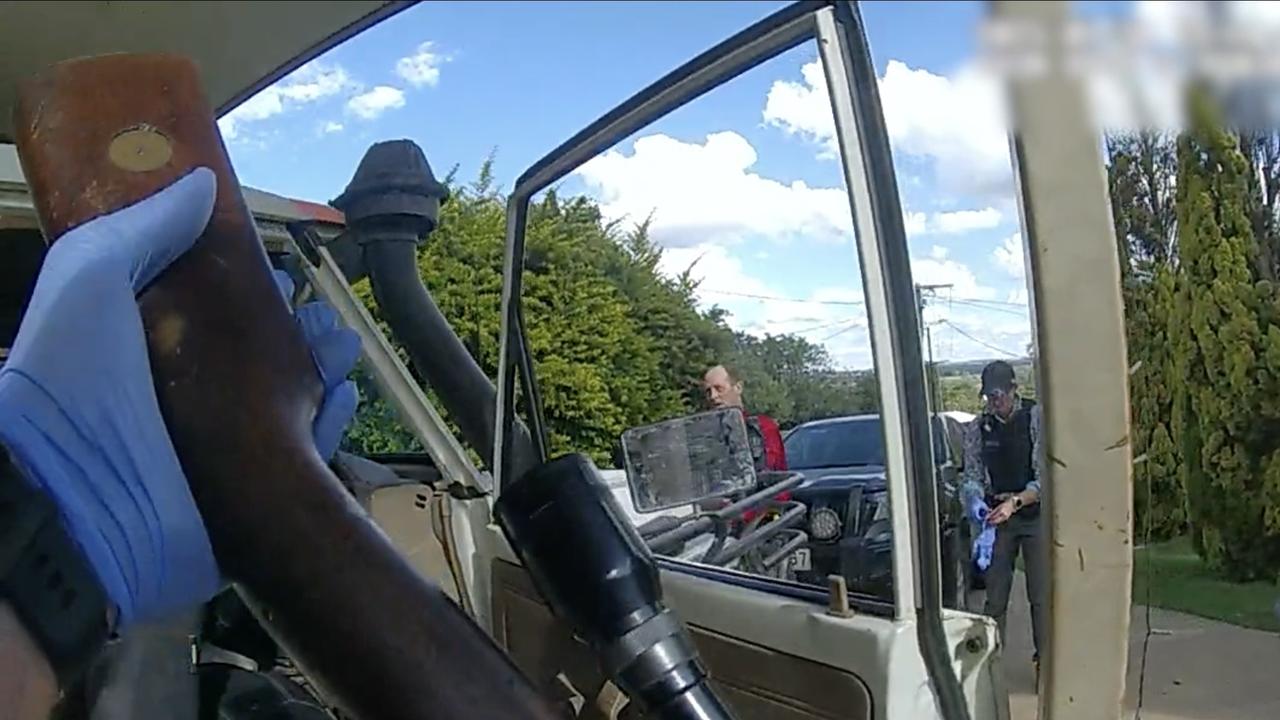
NAMED: The identity of people swept up in massive police raids revealed
A group of people charged with a total of 69 offences including weapons, drugs and stolen cars, allegedly committed across the South Burnett and Darling Downs have been named. SEE THE VIDEO