
NEED TO KNOW: Police crime data on North Burnett towns
DRUG, theft, and drink driving offences appear to be on the rise in these North Burnett towns.

Police & Courts
Don't miss out on the headlines from Police & Courts. Followed categories will be added to My News.
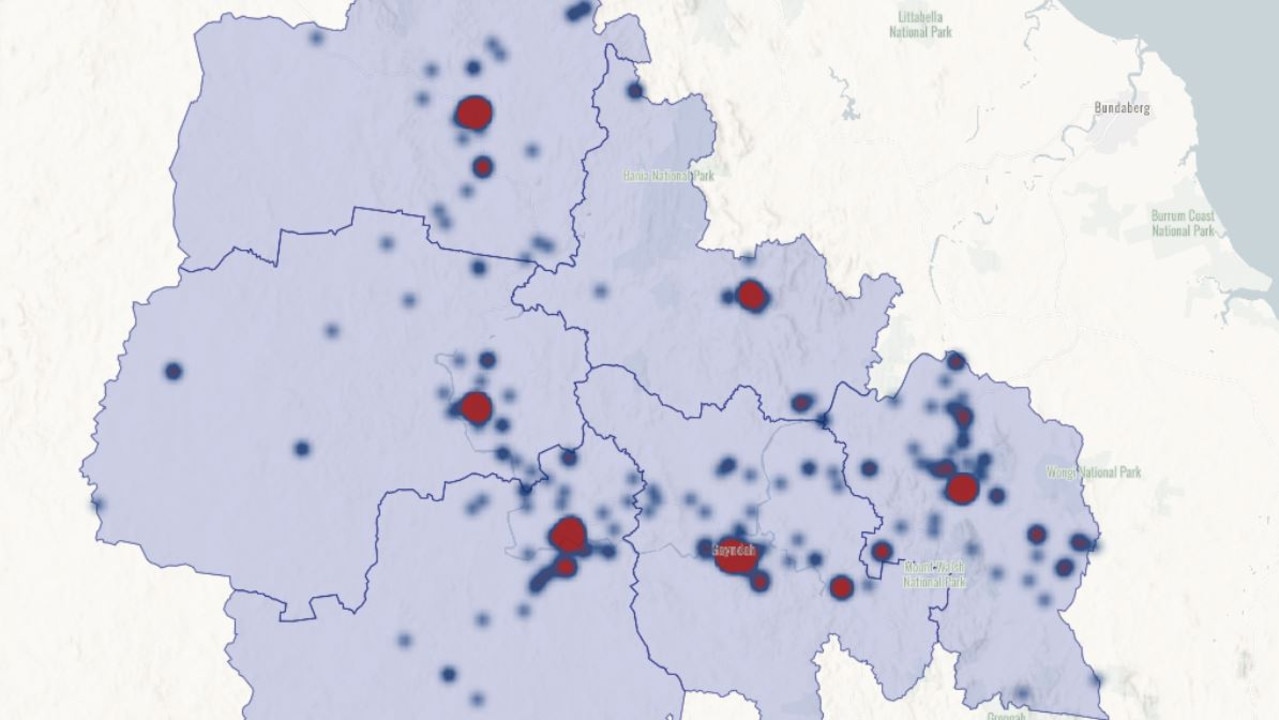
A DEEP dive into the underbelly of the North Burnett in the past two years showed a rise in certain crimes which are plaguing the region.
Data released by the Queensland Police Service from September 1 2018 to August 31 2020 has provided an insight into the different types of offences that are committed, and their frequency.
The extensive breakdown of figures includes time stamps and days when crime occurs, with figures covering all six towns and their surrounds.
Overall the North Burnett had 951 offences occur over the last two years, with traffic and other related offences topping the table with 201 crimes, theft crimes second with 175 offences, and 131 drug offences.
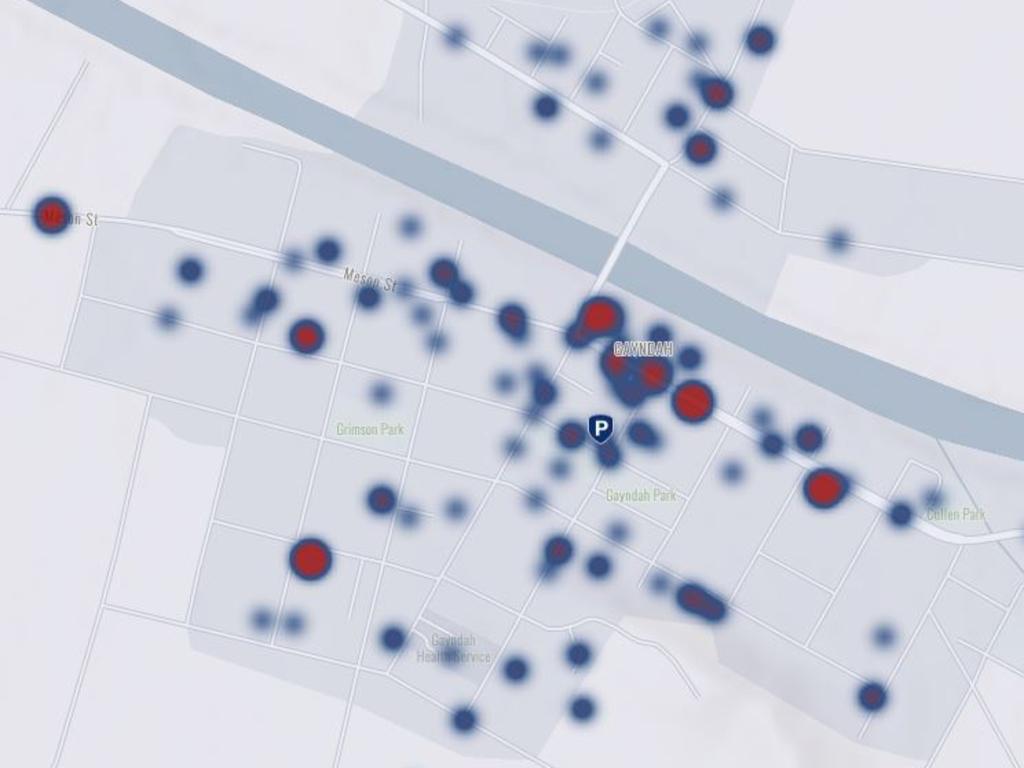
Gayndah led the way in crime in the past 24 months with a whopping 304 offences, 178 of these happening in the township.
Traffic and related offences such as drink or drug driving won out with 84 offences, drugs with 69, and theft with 49.
December 2018 was the worst month of offending for the self proclaimed citrus capital of Queensland, with 23 offences occurring over 31 days.
Friday was its biggest day for crime, with 67 crimes occurring on the cusp of the weekend, with midnight an opportune time for criminals according to the data with 28 offences.
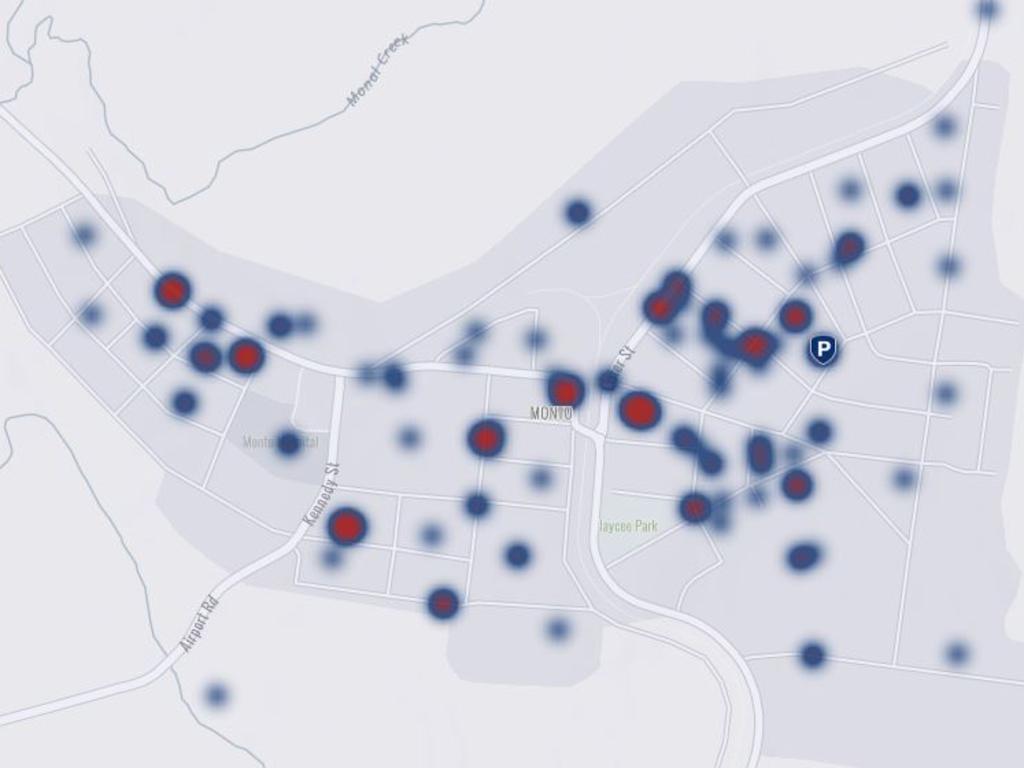
Monto came second with 205 offences, with a total of 193 crimes occurring within the town.
Traffic offences again led the way with 39 incidents, drugs with 30, and unlawful entry with 28.
May had the most offences with 15, and Fridays were again the favoured day for criminals to commit offences with 45 over the last two years.
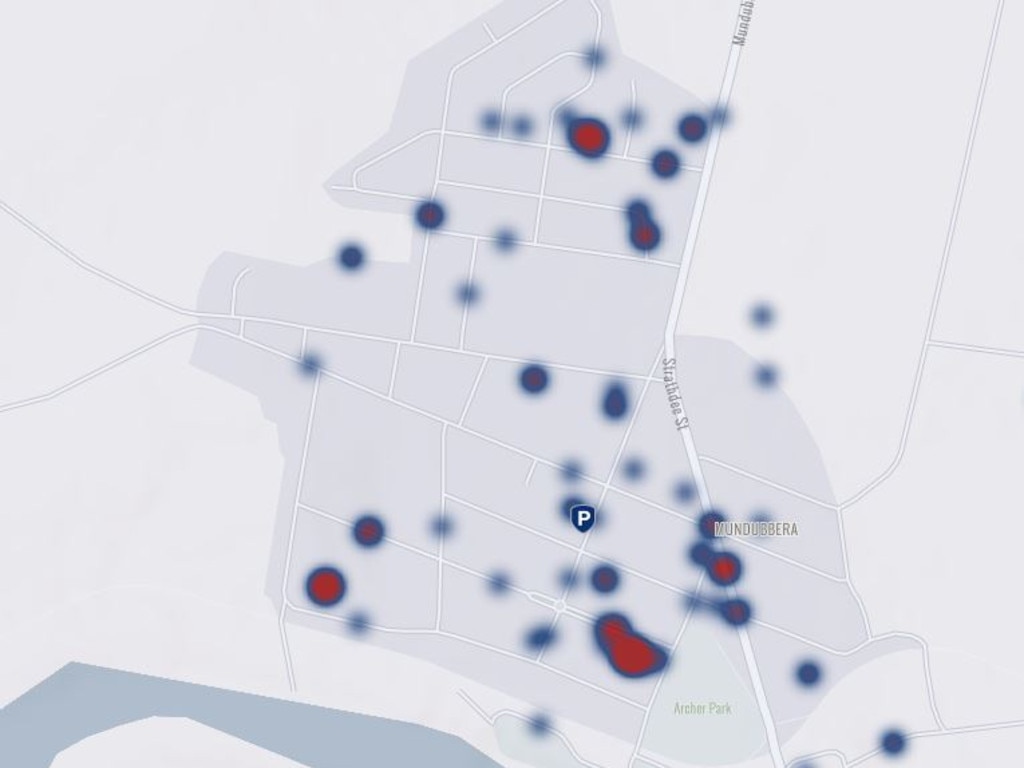
Mundubbera’s police zone was third with 198 offences, with drug offences topping the table with 50 offences, traffic with 44, and theft with 28.
September 2019 and February 2020 were worrying months for the township, recording 15 offences each, the highest months in the last two years.
Contrary to Gayndah and Monto, Saturday had the most incidences of crime, with 49 offences, and 31 offences occurring at midnight.
The remaining towns are as follows:
Biggenden
- 171 Offences
- 39 Drug and theft offences
- 22 Traffic and related offences
- 19 Unlawful entries
Eidsvold
- 114 Offences
- 23 Thefts
- 18 Unlawful entry offences
- 16 Assaults
Mount Perry
- 67 Offences
- 22 Drug offences
- 13 Thefts
- 8 Traffic and related offences

Parent charged after principal allegedly bashed on school grounds
The mother of a student at a regional primary school will face court after the principal, a grandmother, was allegedly attacked on school grounds.

District Court sittings at Maryborough, May 27
Here is a list of District Court sittings at Maryborough on May 27

Everybody appearing at Maryborough Magistrates Court, Tuesday, May 27
Here is a list of matters listed at Maryborough Magistrates Court on Tuesday.

Daughter’s campaign to find truth about mum’s violent death
A woman searching for answers about the death of her mother 45 years ago took Facebook posts about her campaign too far, landing her in court. See why
Everybody appearing at Maryborough Magistrates Court, Monday, May 26
Here is a list of matters listed at Maryborough Magistrates Court on Monday.
District Court sittings at Maryborough, May 26
Here is a list of District Court sittings at Maryborough on May 26