Referendum results show Indigenous Australians supported the Voice, even though the wider country didn’t
While every state and territory apart from the ACT rejected the proposed Voice to parliament, more specific data is revealing.

National
Don't miss out on the headlines from National. Followed categories will be added to My News.
While every state and territory apart from the ACT rejected the proposed Voice to parliament in Saturday’s referendum, Indigenous communities resoundingly supported it.
That support appears to have fallen slightly short of the 80 per cent predicted by the Yes campaign in advertisements before the vote, based on polling by YouGov and Ipsos.
But it does illustrate the awkward reality of the referendum result: Indigenous Australians wanted a constitutionally enshrined Voice, and the rest of the country has denied it to them.
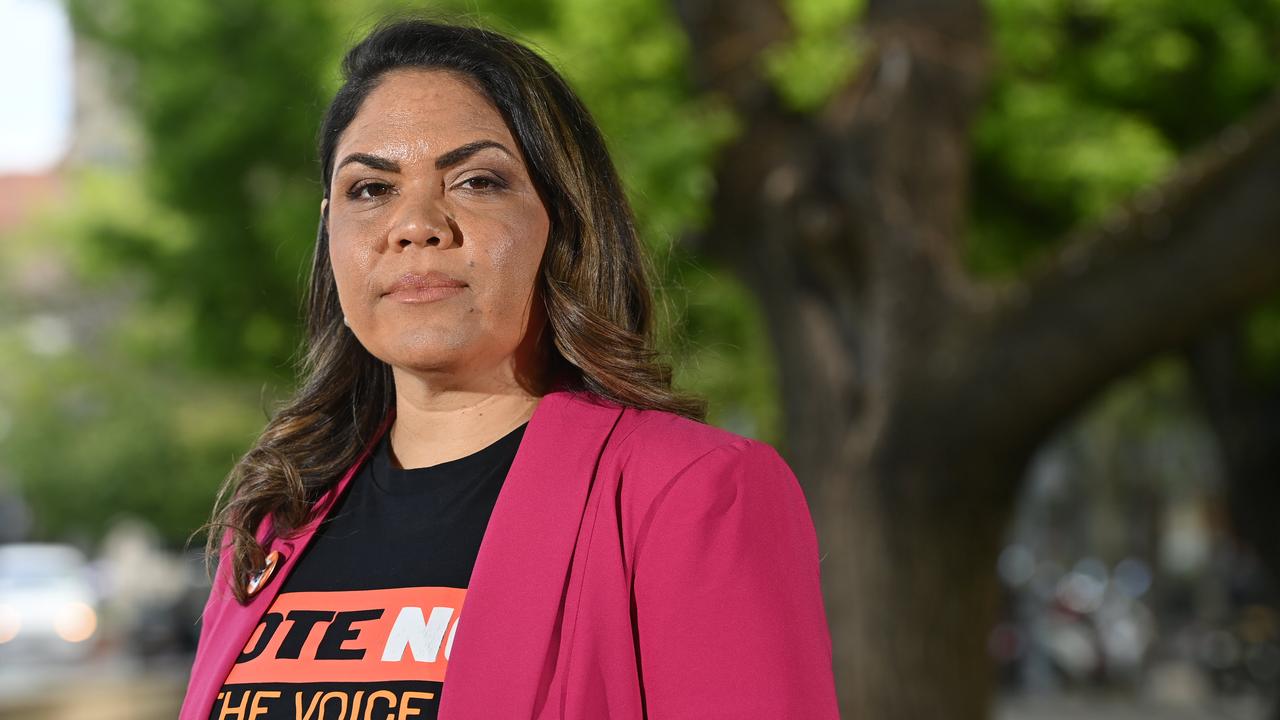
“I knew, having spoken to people throughout the Northern Territory ... that a vast group of Indigenous Australians did not support this proposal,” Senator Jacinta Price, the opposition’s spokeswoman for Indigenous affairs and a leading advocate for the No campaign, said after the referendum was defeated on Saturday.
Vast, perhaps – it depends how you define the term – but certainly nowhere near a majority.
The electorate Lingiari, which covers most of the Northern Territory outside of Darwin, voted No by a margin of 56 per cent to 44.
However it was a different matter in the electorate’s remote, mostly Indigenous communities. Twenty-one remote polling teams from the Australian Electoral Commission surveyed these communities, and all but one of them returned a Yes vote.
In total across the remote communities, 8,638 people voted in favour of the referendum, with 3,134 voting against it. That’s a 73 per cent Yes result.
Lingiari also encompasses Alice Springs, whose population was 21 per cent Aboriginal and Torres Strait Islander in the 2021 census. Alice Springs voted against the referendum, albeit more narrowly than the broader country, with a Yes tally of 45 per cent.
The population of Lingiari’s other major settlement, Palmerston, is only 15 per cent Indigenous, and it voted No overwhelmingly, with the Yes side earning just 22 per cent of the tally. (The part of Palmerston within the NT’s other electorate, Solomon, also delivered a decisive No vote.)
Moving east to Queensland, the story is similar, with small Indigenous communities supporting the Voice but most areas opposing it.
Palm Island, which lies in the electorate Herbert, had an Indigenous population of 91 per cent at the census. Three-quarters of its residents voted Yes.
Mornington Island, which is in the seat Kennedy, voted 78 per cent Yes. Its population is 80 per cent Indigenous. Yarrabah, in the same electorate, is 96 per cent Indigenous, and voted 76 per cent Yes.
The population of Hope Vale, which is in the electorate Leichhardt, is 88 per cent Indigenous. It delivered a Yes vote of 75 per cent.
But on the whole, all of the above electorates voted No, with Queensland’s overall Yes tally barely breaching the 30 per cent mark.


In Western Australia, there was a sharp contrast between the state’s overall result and booths with majority Indigenous populations.
Those booths included Halls Creek, with a 78 per cent Indigenous population and a narrow 52 per cent Yes vote; and Fitzroy Crossing, with a 62 per cent Indigenous population and a more comfortable 71 per cent in favour.
WA’s overall support for the referendum was just 36 per cent.
“Of course, there was not complete uniformity of opinion in the Aboriginal and Torres Strait Islander community. There’s not about anything, in any community,” Health Minister Mark Butler said while speaking to Sky News.
“But this idea that there was not overwhelming support for the Voice by Aboriginal and Torres Strait Islander people, I think, is a furphy that was put to rest by some of those results.”
The lack of uniformity was evident in New South Wales, where multiple majority-Indigenous communities actually voted against the referendum.
Brewarrina, in the electorate Parkes, has an Indigenous population of 56 per cent. It delivered a Yes vote of just 35 per cent. Wilcannia, in the same seat, is 51 per cent Indigenous and was at 39 per cent support. The electorate as a whole voted No with a whopping 79 per cent.
It had five remote mobile teams, all of which returned results favouring No.
In South Australia, whose overall support for the referendum was 35 per cent, there were three remote mobile teams, which surveyed 1,039 people. Support for Yes was at 61 per cent in that group.
Originally published as Referendum results show Indigenous Australians supported the Voice, even though the wider country didn’t


