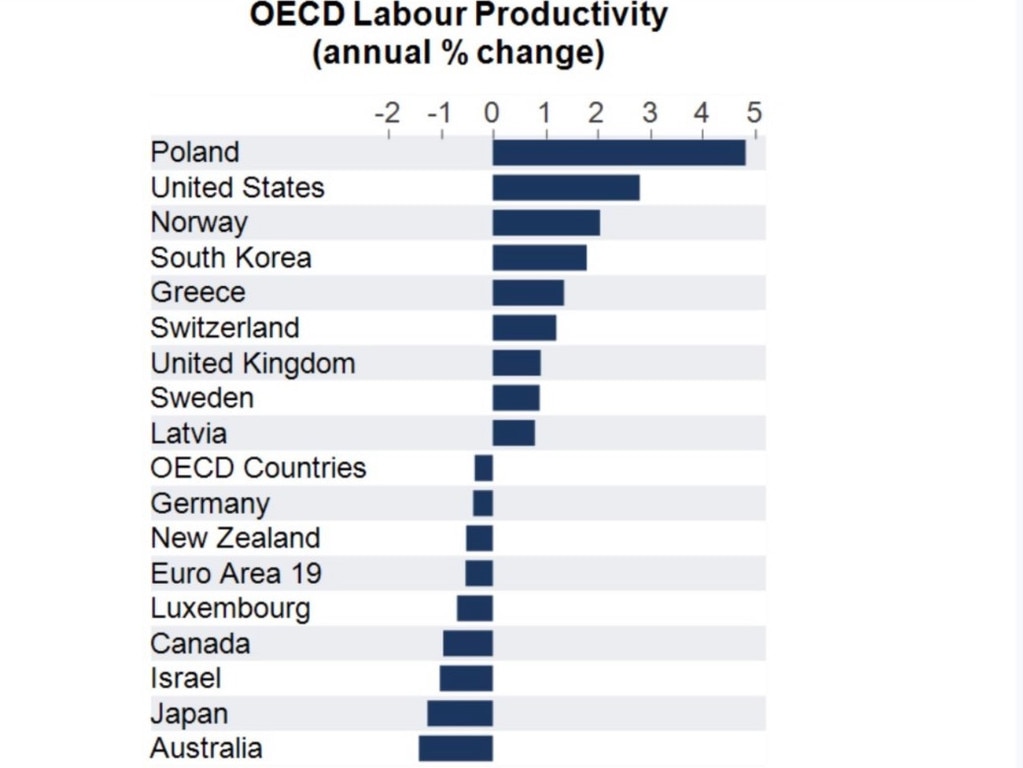
Shocking graph shows dramatic fall-off in Australian labour productivity
Australians are getting poorer and a leading economist has produced a simple chart that shows why.

Breaking News
Don't miss out on the headlines from Breaking News. Followed categories will be added to My News.
Australians are getting poorer and a leading economist has produced a striking graph to explain the fall-off in living standards.
AMP chief economist Shane Oliver, in a post to X from Friday, shows off a graph displaying annual changes in labour productivity across several advanced economies.
Australia sits at the bottom of the group, registering a negative change in productivity, compared to a nearly 5 per cent growth rate in the US and 2 per cent growth in Norway.
“Australian labour productivity growth running at the bottom of the OECD … it’s the basic reason why living standards are falling in Australia,” Mr Oliver writes.
Labour productivity refers to the amount of goods produced by a worker in a set amount of time.
Higher or improving productivity means a worker produces more in less time.
It is a key indicator for living standards because greater productivity is often tied to higher wages, as employees become more valuable to an enterprise.

It also means more goods will be produced, making things cheaper for everyone.
In a more detailed research note, Mr Oliver said a surge in government spending was “exacerbating” Australia’s productivity slump and contributing to the drop in living standards.
“The surge in public spending is exacerbating Australia’s productivity slump with productivity down another 0.8 per cent over the last year as private market sector productivity is invariably higher than public sector productivity and as public spending squeezes out private business investment, it is likely exacerbating the weakness in private market sector productivity,” he said.
“And weak productivity growth makes it harder to get inflation down and will depress long term growth in per capita GDP, and hence in living standards.”
Public spending has now hit a record 28 per cent of GDP, he said.
“(It) has made the Reserve Bank of Australia’s job in controlling inflation harder because it’s kept demand in the economy higher than otherwise would have been the case, which has meant that interest rates have had to stay higher for longer to slow demand, and hence inflation, which in turn has meant that private spending has had to be squeezed by more than would otherwise have been the case,” he said.

“Households have paid for this by having to cut back their discretionary spending.
“In other words, were it not for the surge in public spending inflation would now likely be lower and so too would the RBA’s cash rate.”
Mr Oliver said “politically unpopular” policies were needed to reverse Australia’s productivity decline.
“Federal and state governments need to slow their spending to stop squeezing out private spending and do more to fundamentally boost productivity, which requires tax reform, labour market deregulation, competition reforms,” he said.
“And in the process work in tandem with the RBA rather than against it.
“Unfortunately, its hard to be optimistic with a Federal election ahead.”
The next federal election will take place before May 2025.
Originally published as Shocking graph shows dramatic fall-off in Australian labour productivity


