
Mortgage row Baby Boomers always get wrong
When talking mortgages, this is the most common argument trotted out by Boomers. But it doesn’t prove anything.


Interest Rates
Don't miss out on the headlines from Interest Rates. Followed categories will be added to My News.
ANALYSIS
When it comes to the intergenerational debate between Baby Boomers and younger people, there is one talking point that almost always get trotted out: How Boomers at one point paid 17 per cent interest rates on mortgages.
The debate about housing affordability and which generation has it harder is scarcely complete without this talking point being raised.
But how does that period in history, the good and the bad, stack up against the challenges presented to today’s mortgage holders.
Interest rates and the economy
In May 1989, the average standard variable mortgage rate hit 17.0 per cent, after rising from a cycle low of 13.5 per cent in May 1988. This increase in rates saw the average mortgage interest repayment rise by 25.9 per cent.
Mortgage rates would stay at 17.0 per cent for 10 months, before the RBA embarked on the largest interest rate cutting cycle in Australian history. By the time the dust settled and rates stopped falling in September 1993, the average standard variable mortgage rate stood at just 8.75 per cent.
It’s worth noting that this sort of rate cut cycle was completely foreign to Australian households at this point. In the more than 60 years of data that is available from the RBA on mortgage rates, prior to this point, rates had never fallen by more than 2 per cent.
The late 1960s through to the absolute peak in rates in 1989 was instead defined by a consistent up trend in mortgage rates. Between August 1968 and May 1989, Australians saw the average mortgage rates rise from 5.38 per cent to 17 per cent.
While the large rate cut cycle of the early 1990s was an absolutely enormous windfall for the Baby Boomer generation, it did come with a cost. Between December 1989 and December 1992, unemployment rose from 5.9 per cent to a peak of 11.2 per cent.
But for the majority who did hold on to their jobs and had a mortgage, they had a whole lot more cash in their pockets. Between the absolute peak in mortgage rates and the cycle bottom in 1993, the average mortgage repayments fell by over 44 per cent.
In comparing this era with the present day, it’s worth noting how very different the underlying circumstances are. When interest rates hit 17 per cent in 1989, Australia’s household debt to GDP ratio was 44.2 per cent. Today the nation’s household debt to GDP ratio is more than double its 1989 figure, sitting at 113.6 per cent of GDP.
Are mortgage repayments higher today?
Purely in terms of interest repayments, the burden on mortgage-holding households is higher today than it was at its peak in 1989 and there may still be further rate rises ahead. However, where things really start to get challenging is that principal repayments consume a much greater proportion of household income today than it did back in the 1990s.
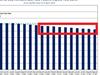
According to a recent analysis by AMP chief economist Shane Oliver, if the cash rate was to reach 4.1 per cent, the total burden on mortgage holders as a percentage of household disposable income would rise to its highest level ever, as shown in the graph below (Source: AMP).
Based on the average payable mortgage rate, mortgage holders have seen their interest repayments rise by 108.4 per cent over the last 10 months. While the magnitude of the rate rise seen in 1988-1989 is the same as today, a rise in the cash rate of 3.5 per cent, in relative terms the rise in mortgage repayments is more than four times larger in 2023.
The quantifying
It’s here where attempts to quantify the challenges faced in different eras start to get even more difficult. How you, the reader, chooses to weight the impact of say rising unemployment against plummeting interest rates is very much a matter of personal perspective.
In relative terms, the hardest part of the era of 17 per cent interest rates in aggregate arguably wasn’t the high interest rates themselves but their knock-on effect. The rise in rates that led them to that level was actually significantly smaller in both relative and headline terms to the prior three interest rate rise cycles.
However, it’s worth noting that this is based on aggregate figures, not on how an individual household may or may not have fared.
For example, if we were to take a modern household who borrowed more than six times their household income on a sub-2 per cent mortgage and is now reverting to a variable rate starting with seven, that wouldn’t be representative of the experience of mortgage holders in aggregate.
Arguably the biggest challenge of the late ’80s and early ’90s era was the more than 5 per cent rise in the unemployment rate, which saw a larger proportion of Australians out of work in headline terms than at any time since the Great Depression.
On the other side of the coin, this was followed by the largest collapse in mortgage repayments for households in our nation’s history and an economic boom that would, in headline terms, continue all the way up to the pandemic.
For mortgage holders in the present day, the outlook is uncertain. Interest rates may not have finished rising yet and if they have, if it’s anything like the early 1990s, some households may not like the economic damage that could be required for rates to come down swiftly.
As the situation continues to evolve and we find out if Australia’s status as The Lucky Country comes to the aid of our economy once more, we’ll be able to better quantify the two eras with a greater degree of context.
If we can avoid a recession and a large rise in unemployment, perhaps one could make the argument that the present day was an easier time.
Ultimately, the choice is yours. Based on the data which era do you think had it harder?
Tarric Brooker is a freelance journalist and social commentator | @AvidCommentator

Originally published as Mortgage row Baby Boomers always get wrong
Major bank flags big risk in rate cut
Australia’s biggest bank says there may be some brief relief for those priced out of owning a home, but there could be a brutal side effect to cutting rates.

ASX 200 hammered on Trump tariffs
Nearly $50bn was wiped off the Australian sharemarket on Monday as fears of a trade war led by US President Donald Trump tariffs ripped through the local market.
Proof of how far off target Australia is
Australia remains behind its ambitious target of 1.2 million new homes by 2029 despite a bounce in new housing approvals in December.

Major turnaround in Aussie habit
Aussies have returned to the stores on the back of cost-of-living relief, lifting consumer spending for the first time in nearly two years.

Major bank’s huge interest rate move
One of the big four banks has made a major call ahead of any Reserve Bank of Australia decision to cut the cash rate.

Figures hide Aussie families’ pain
Australians are still feeling the pinch of cost-of-living rises even though the rate of inflation is slowing.