Top earners paying the benefits bill
The top fifth of households by income are almost entirely supporting the bottom 60 per cent of earners, a report says.

The top fifth of households by income are almost entirely supporting the bottom 60 per cent of earners, according to a report that argues the dwindling share of net taxpayers is making it harder for parliaments to govern wisely.
Analysis of the latest official survey of incomes and benefits, including in-kind health and education payments, shows the bottom 60 per cent of households received more in benefits than they paid in taxes, including GST and excise taxes.
Based on 2016 data, the top fifth of the nation’s nine million households, whose incomes averaged $269,000, were paying more than $1000 a week into the tax-transfer system, while the bottom fifth, whose incomes averaged $30,300, received $619 a week after subtracting benefits received, cash and in kind, from taxes paid.
Robert Carling, a research fellow at the Centre for Independent Studies, which conducted the analysis, said: “The emergence of a large segment of the population that in a sense ‘votes for a living’ could help explain much of what has gone awry with public policy in Australia in recent years.”
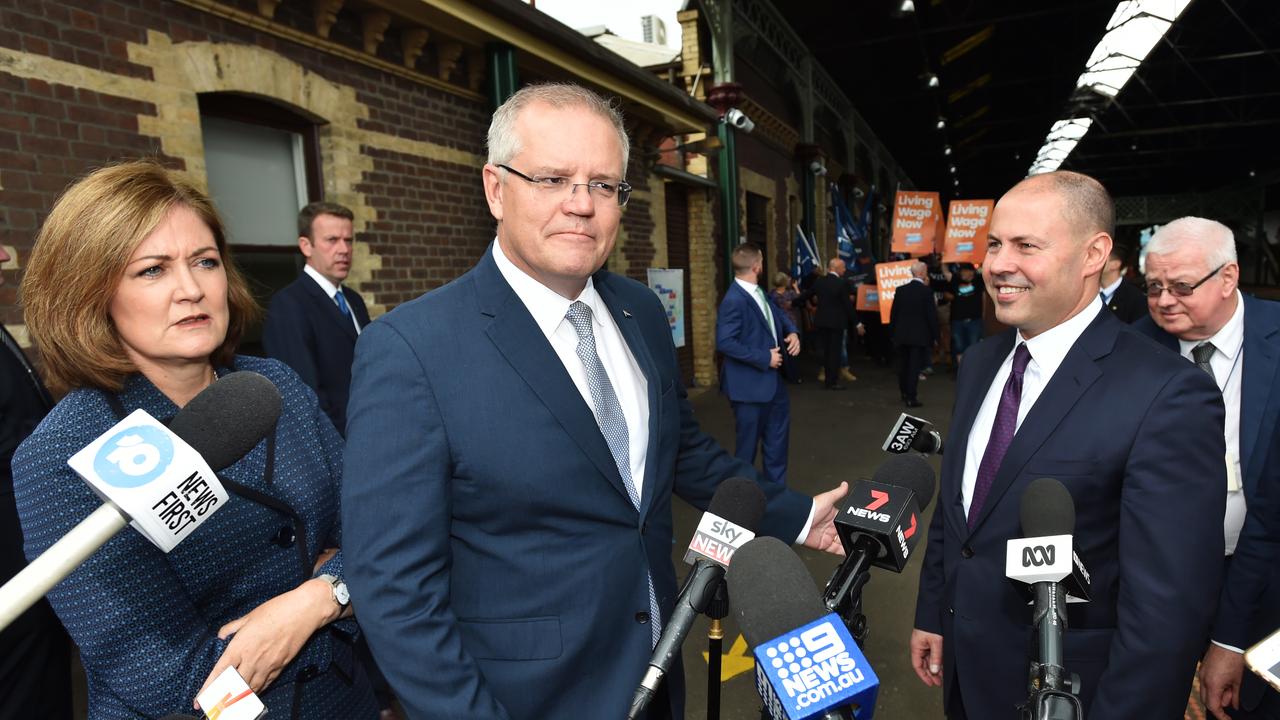
The figures emerged as Scott Morrison dumped a proposal, from the 2014 budget, to gradually lift the Age Pension age from 67 to 70. The move will cost the government about $5 billion over a decade in extra payments.

“This is an illustration of how skewed the tax system is, with the top 20 per cent doing most of the heavy lifting,” Mr Carling said.
For Jessica McGuire, a manager at an investment bank, and her husband, Andrew, a product manager at a pharmaceutical company, the comparative figures of how big a share of tax they pay is a “difficult” idea. “We’ve always paid it so you just don’t really think about what you get back,” Ms McGuire, 32, said.
The couple, who are looking to sell their apartment so they can buy a house, fall into the top fifth bracket of household income.
“I’m not against paying a bit more if it means that people at the bottom get some more out of that,” Mr McGuire, 30, said.
He says the current distribution of tax “makes a better community and lifestyle for everyone”.
“Regardless of what you make, a lot of other people work just as hard as you,” he said.
The middle fifth of earners were net recipients of an average of $274 a week, while the second-top quintile contributed an average of $69.
The analysis comes a week after the Productivity Commission rejected claims that inequality had been rising since the global financial crisis, pointing out that incomes adjusted for inflation had risen strongly across the income distribution.
On a narrower measure, which assesses social-security cash payments against personal income tax paid, 46 per cent of the adult population paid no tax after deductions and offsets. Among 18 to 64-year-olds, the share of net recipients fell to 38 per cent, the CIS found.
“It is not just voter behaviour that’s affected; political parties will also curry favour with this group and become more interested in buying votes than selling good policies,” said Mr Carling, a former Treasury official.
“If net beneficiary status motivates voters in favour of higher benefits and political parties to design policies to cater for this demand, this effect may have strengthened since the 1980s with the spread of benefits in both cash and kind to the middle class.”
The study, based mainly on the ABS’s six-yearly survey of taxes, benefits and incomes, found that the percentage of public-sector employees, across all levels of government, had stabilised at about 11 per cent, currently 1.9 million, of the voting-age population.
“Bringing it all together, just over 50 per cent of households are net beneficiaries of the tax/transfer system as broadly defined,” the study concluded.
Compared with surveys in the 1980s and 90s, the share of median-income households that contributed has shrunk greatly.
“It should be emphasised that the existence of some number of net beneficiary households is to be expected; is not controversial, and is indeed desirable,” the study said.
A recent survey by the Per Capita think tank found more than 75 per cent of voters favoured more spending on health and education and more than half supported more spending on social security, which at the federal level is expected to increase more than 10 per cent over the next three years to $194bn.
Geoffrey Brennan, an economics professor at ANU who wrote a book last year, Democracy and Decision, on voters’ rationale, has told The Australian voters tend to vote based on principles rather than their own circumstances because they realised their own vote made little difference to the outcome. “Voting is rather closer to cheering at a football match rather than choosing an asset portfolio,” he said.
More Coverage

Add your comment to this story
Franking ban to hit more retirees
An extra 10,000 retirees will bear the brunt of Labor’s proposed ban on franking credit refunds.
Focus on ‘more bang for our buck’
The nation’s leading infrastructure think tank has warned against wasting funds on “vanity projects” in the lead up to the federal election.
To join the conversation, please log in. Don't have an account? Register
Join the conversation, you are commenting as Logout