
Big-picture view needed to get workers back on their feet
Despite a real rate of unemployment in April which we believe was running at about 10 per cent, there is some grounds for optimism.
And, along with some renewed optimism, it’s now time for a bit of leadership from a national cabinet that is becoming national in name only, with some premiers forgetting they’re part of a bigger entity called Australia.
Evidence is mounting that smaller states and demographics with the lowest rates of COVID-19 infections are also showing some timid signs of returning confidence in the jobs market. Unfortunately, the reverse is also true.
Cases of COVID-19 in the past 14 days have petered out to zero, or near zero, levels in Queensland, Western Australia, South Australia, the ACT and Tasmania. Payroll data from the Australian Bureau of Statistics for the fortnight of April 18 to May 2 shows a recovery in jobs across the same states and territories, with the exception of WA, which remained steady. The problem states as far as COVID-19 infections and continued job losses remain the big two: NSW and Victoria.
But first the evidence of a recovery. You should start by disregarding the official unemployment rate for April of 6.2 per cent. The COVID-19 job restrictions hit younger and older casual workers equally. When young workers lose their jobs, they register as unemployed, but when older people lose their jobs, they tend to move out of the workforce statistics and are largely forgotten. Correcting for this, the real April unemployment rate was 9.6 per cent.
Fortunately, we now have other measures we can use to measure jobs lost and jobs gained. The Australian Taxation Office and Australian Bureau of Statistics have recently combined to produce a fortnightly data release covering more than 10 million Australians using the Single Touch Payroll system.
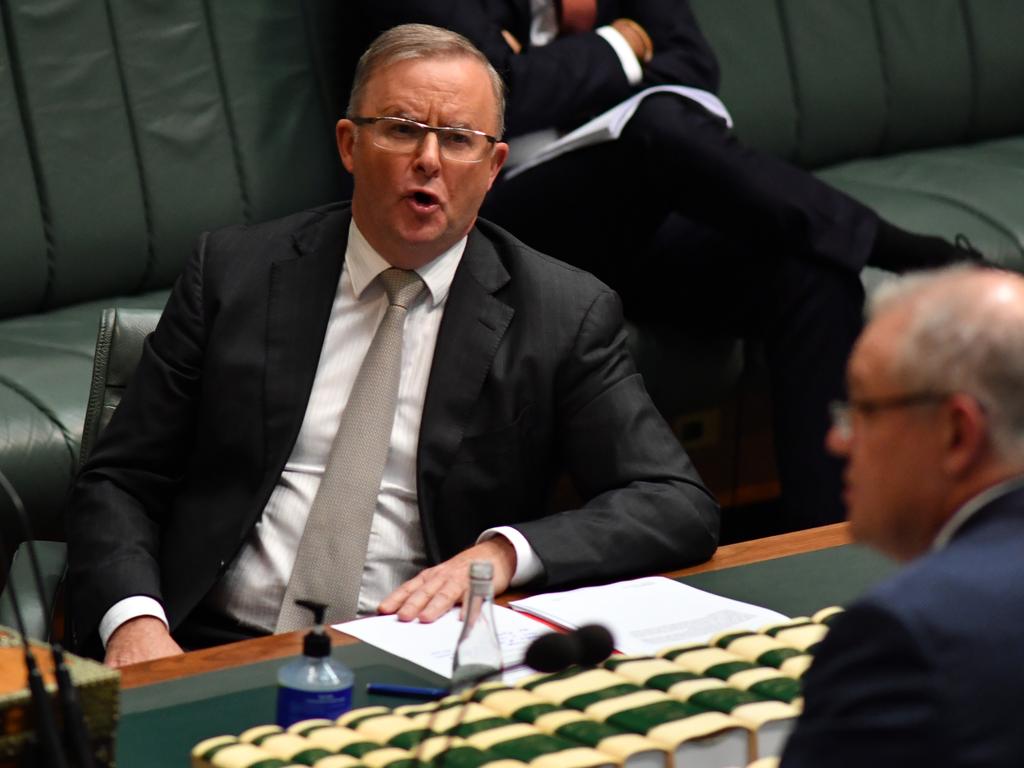
On March 22, Scott Morrison announced stage 2 lockdown changes, to be progressively implemented, and on March 30 he announced the JobKeeper program. The ABS payroll data showed the announcements had no impact on the labour market until April 4. This was set as the benchmark date with an index number of 100, so we could measure the jobs impact in two- or three-week intervals from then.
In the first stage of the jobs crunch, to April 4, 6.3 per cent of the labour market lost their jobs, led by low-paid young and older workers usually employed in the industries of accommodation and food in coastal and rural regions, and younger workers in arts and recreation in suburbs close to CBDs of our major cities.
Every state was impacted and the impact was massive. When you lose about 6.3 per cent of a labour market of 13 million jobs in three weeks, it tends to be noticed.
It bears repeating that nearly 90 per cent of the damage inflicted on the jobs market by the national cabinet until April 4 took place as a direct result of the lockdown changes in this first stage.
The total changes in jobs across stages 2 and 3 leading up to May 2 were relatively minor, representing a combined total of “only” 1 per cent of jobs, but they represented important reshuffles of those feeling the pain from national cabinet lockdowns.
The second stage, from April 4 to 18, deepened the cuts of stage 1 for younger and older workers in accommodation and food, and arts and recreation, across all states, but especially Queensland and SA. The national impact was a marginal drop of 0.8 per cent.
Our profiling of the areas hurt most in stage 2 were mainstream working families and semi-skilled blue-collar workers — those who have been in most danger of losing their jobs due to digital disruption and who live on the fringes of our major cities where voters still go to church. We’re looking here at first- and second-income-quartile families and the stereotypes that elected the Prime Minister in 2019.
Those that held their ground in the early part of April were the wealthier, inner-city groups, including industries dominated by more secure jobs in the public sector, such as public administration, education, health and utilities, in suburbs where last year’s federal election saw big swings to Labor, led by Bill Shorten.
From April 18 to May 2, stage 3 saw a very small (0.2 per cent) net change in the national payroll data, but a discernible correction to damage from stage 2, with a recovery in jobs for younger Australians usually working in accommodation and food, and arts and recreation, along with more jobs for teachers, healthcare workers and miners. The states and territories to benefit the most from these changes were Queensland, the NT, SA and Tasmania.
Job losses in stage 3 were dominated by the highly paid group of professional consultants, followed by those in wholesale, the media, real estate and manufacturing.
These industry job losses left a heavy demographic footprint on NSW, Victoria and the ACT and on their higher socio-economic-status inner-city suburbs. Stage 3 represented the time when economic reality sunk in for GPs, lawyers, accountants and consultants, along with the big employers in manufacturing and wholesale. Changes in actual payroll figures improved in stage 3 in states where new COVID-19 cases are on the way out and worsened in the two big states where COVID-19 outbreaks are continuing to occur.
We can’t tell here with COVID-19 infections and the fortunes of the labour market which is the horse and which is the cart, but my money is on COVID-19 as the horse. Get the numbers down and confidence is restored, get the confidence up and employers start rehiring.
Unfortunately, the recovery cart has nine drivers at the moment and the Queensland driver is up for re-election.
All the drivers need to realise it is reasonable to conclude that the jobs lost in the early stages of the collapse are not going to start coming back until the shutdown of tourism and hospitality, and restrictions on interstate travel, are wound back.
When it comes to tourism jobs, the clock is ticking for all states, but especially for Queensland, where tourism and hospitality rely heavily on the winter market.
Some leadership is needed here, Scotty, because you’re the one paying for it.
John Black is a former Labor senator for Queensland.
He is executive chairman of profiling company Australian Development Strategies


Despite a real rate of unemployment in April which we believe was running at about 10 per cent, data released in the second half of last month on COVID-19 infections and the labour market gives us some grounds for optimism.