How Australians abandoned the regions for the ‘lifestyle zone’
As ‘blue bits’ beyond the edges of our capital cities emerge – boosted by the advent of work from home – Australians are changing the way they live and work in a post-pandemic world.

Every week there is intense media interest in data releases that are considered likely to signal trends for the next quarter, for the coming year or, at a pinch, across the budget’s forward estimates.
And while I understand the importance of these short-term indicators, I think there are equally important long-term datasets that reveal structural changes to the way we live, work and, it has to be said, pray.
Let me explain.
Last month the Australian Bureau of Statistics released its updated historical population data series that tracks various metrics across 100 years. This long-term dataset tells stories of generations, of long-forgotten behaviours, of emerging forces and of ascendant preferences likely to shape our way of life across the balance of the decade.
This is a dataset on which policy and investment decisions might be made.
I have assembled data and graphics (with the assistance of data scientist Hari Hara Priya Kannan) from this and other ABS sources to show how long-term trends are shaping our short-term future. A trend that can be tracked as unwavering in its direction across decades isn’t likely to be knocked off course this quarter or later this year.
The long-term trends I have chosen include settlement of the Australian continent this century, the unemployment rate across 30 years, the rise and fall (and switch) in fertility across 100 years, and the curious case of diminished religious belief since 2006 .
1. Bush, beach, ’burbs – Aussies forever in pursuit of lifestyle
My fellow Australians, we the people of the 21st century have boldly (or, more likely, unwittingly) engaged in a process of resettling the Australian continent. Whereas previous generations populated the marginal lands of the interior, we have chosen to retreat to an emerging lifestyle zone (including tree change and sea change) that offers the convenience of occasional access to the big city.
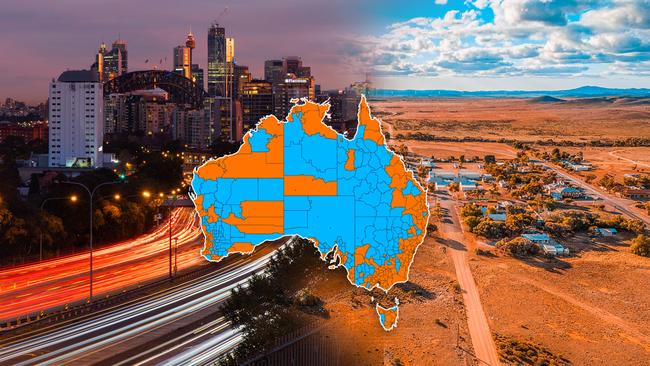
In the accompanying map I show areas of net population growth and loss by local government area between 2000 and last year. (Data for this year will be released next March.) In broad terms we have added eight million to a base of 19 million thus far this century, with more than half being drawn from overseas (including students).
But we also have retreated from parts of the interior stretching from the western slopes of the Great Dividing Range to the flatlands of the West Australian wheatbelt.
Yet outside drought years we continue to increase agricultural output; this applies especially to wheat tonnage as measured by the ABS, up from 25 million tonnes in 2000 to 36 million tonnes in 2022. And bear in mind that global population is still two billion below “peak humanity” (10.4 billion) projected by the UN in the 2080s. Australia’s wheatbelt farmlands must deliver even greater output during the next half century.
Depopulation of parts of the interior confirm that farming is becoming more efficient and automated. No need for labour reserves to congregate in wheatbelt towns if cropping, for example, is largely mechanised. The same logic applies to mining, which has evolved this century to include a contingent of fly-in, fly-out workers.
Fewer people in some remote towns means greater reliance on technology to deliver consumer goods and human services including health, justice, retail, education and even church services. It also means that some footy teams have had to merge with those of rival towns to survive.
In contrast, the rise of vast “blue bits” (areas of population growth since 2000) confirms a core Australian value, if not obsession: the relentless pursuit of lifestyle. What could be better than a three-bedroom Darryl Kerrigan house positioned within the commuter suburbs of a big city?
How about a four-bedroom, two-bathroom (relatively affordable) lifestyle home offering occasional city access, and not having to commute five days a week? The rise of a vast lifestyle zone beyond the edges of our capital cities boosted by the advent of work from home (and other flexible work arrangements) will continue to shape the way Australians live and work in a post-pandemic world.
2.Unemployment shrinkage – blame it on the baby bust
It was predicted by demographers in the 1990s and now it’s here. It is the baby bust. Reduce fertility for 50 years and the number of workers entering the workforce at age 15 (or even years later) no longer offsets the number of baby boomers exiting the workforce at 65.
Some boomers remained in the workforce during the pandemic restrictions, but as borders reopened a life’s-too-short mindset prompted many to finally call it quits. By this year, boomers born between 1946 and 1959 are aged 65-plus. The balance born between 1960 and 1964 will tip across the so-called retirement line before the end of this decade.
One outcome of this baby-bust trend is a shrinking pool of unemployed labour. This isn’t just an Australian issue; it is a global trend that will not right itself anytime soon, especially in the West where fertility rates have been in decline since the 1970s.
In the accompanying chart I show the national unemployment rate across 48 years from 1976 to this year. This timeframe includes the last non-pandemic-induced recession (1990-91), which triggered an unemployment peak of 12.1 per cent in February 1993. Thereafter the unemployment rate dropped as the economy recovered.
Since the early ’90s recession the unemployment rate seems to have jumped only as a consequence of the global financial crisis in 2008 and the pandemic in 2020.
Otherwise this rate has been trending downwards (to less than 4 per cent), which suggests a long-term demographic force (that is, not enough workers) has been shaping unemployment.
A continuation of labour shortages across the developed world will drive demand for immigration and skilled workers. It also will prompt change effected by automation, digitisation, robotics and perhaps by an employer base leaning into the use of AI.
All of these short-term trends flow in part at least from long-term changes in fertility.
3. Rise, fall and switch – the story of fertility
And speaking of fertility, surely the most powerful chart released by the ABS last month is the 100-year perspective of Australian fertility by age group.
Generally the fertility rate is cited as a single figure: down from a peak of 3.4 births per woman during the baby boom in 1960 to just 1.8 today. In South Korea, the fertility rate is less than one. However, the age-specific fertility rate shows how Australians responded to important social change and economic forces. The Depression of the ’30s diminished fertility across all cohorts within the child-bearing years (A determined effort in an era that predated oral contraception.)
The post-war era of course delivered a baby boom that peaked in the early ’60s.
However, within a decade social change enabled women to pursue careers and further education, especially in their 20s. Fertility rates dropped across the 20-something cohort from the ’70s and increased across the 30-something cohort during the ’80s.
During these years Australian households transitioned from one to two-income households, driving changes to the way we lived, worked and played. Housing transformed: out with separate kitchen and loungeroom; in with the kitchen-family room and a TV that was always on. (Breakfast TV shows blossomed.) Couples wanted to be with their families, not stuck in another room cooking.
In, too, came the concept of the two-car households, the idea of travelling to Queensland to visit a theme park, the notion of going out to a suburban restaurant for a cheap meal instead of cooking a roast at home. This simple yet engaging chart tells the story of the evolution of the modern Australian household. It is more than a collection of data points, it is a powerful social document.
And if my overall proposition is correct, that Australians seek out and value quality of life, then current fertility trends – capable of reshaping the way we live – aren’t about to change any time soon.
4. The curious case of the belief curve – uptick around the corner?
There is a question in the census that asks: what is your religious affiliation? Many Australians say “nothing” but many also say they are believers in something. It is this belief/non-belief equation that I think also tells a story, not just of modern secular (that is, non-religious) Australia but also of the way our priorities change across the lifecycle.
At the time of the 2006 census 78 per cent of the Australian population (responding to this question) said they were believers in something, a god of some sort. Just 15 years later this proportion dropped to 58 per cent. One in five Australians effectively “lost faith” over these years. And while this diminution in belief must be of concern to some faiths it is not the main indicator of social change that stems from this data source.
When belief is tracked by single year of age (parents ascribe a religious affiliation to their kids) a remarkable curve emerges. It shows our propensity to believe across the life cycle. The curves for 2006 and 2021 are the same; they’re a pair of like-minded lines that track the matter of belief as we journey through life.
We start off being devout as kids at home with Mum and Dad and peaking at about the age of 16 (and possibly at a religious school). However, as we leave home our tendency towards belief diminishes, reaching a low point at the ages of 23 to 27; never are we as godless as we are in our mid-20s. Or at least that’s what the evidence suggests. By the mid-20s we are young, fit and healthy. Our parents and perhaps even grandparents are still with us. Why would we think about the hereafter when the here and now is so good?
But from the late 20s onward our values shift. We commit to relationships, have children, make decisions about schooling. The religious belief curve rises as a consequence. And in fact belief continues to rise reaching a peak at 80 per cent to 90 per cent of the population in life’s later decades. It could be said there are none so devout in the Australian community as those most likely to meet their maker, imminently. Or again that’s what the data suggests. Yet even though between 2006 and 2021 fewer Australians declared belief in a god of any sort, the curve remains. And the reason this curve doesn’t change shape is because it tells a fundamental truth.
Later in life Australians think about the hereafter. And with five million baby boomers now straddling the 60s and the 70s it is therefore quite possible that we could see an uptick in belief, in some kind of greater religiosity, as a generation of boomers contemplate the end of life in the late 2020s and 2030s.
In this instance the long-term trend suggests there may be a change of direction in years ahead.
5. Conclusion – the way we live
While I understand the obsession with short-term indicators of tough times ahead, what I find equally interesting are long-term trends that suggest we’re unlikely to alter course or we’re due for a change. In either case hopefully there’ll be more of these 100-year datasets published by the ABS so we can occasionally lift our sights to see where we’ve been and how far we’ve changed to better appreciate the pathway ahead.
Bernard Salt is founder and executive director of The Demographics Group. Data by data scientist Hari Hara Priya Kannan.
To join the conversation, please log in. Don't have an account? Register
Join the conversation, you are commenting as Logout