Coronavirus: the biggest losers in a world of hurt
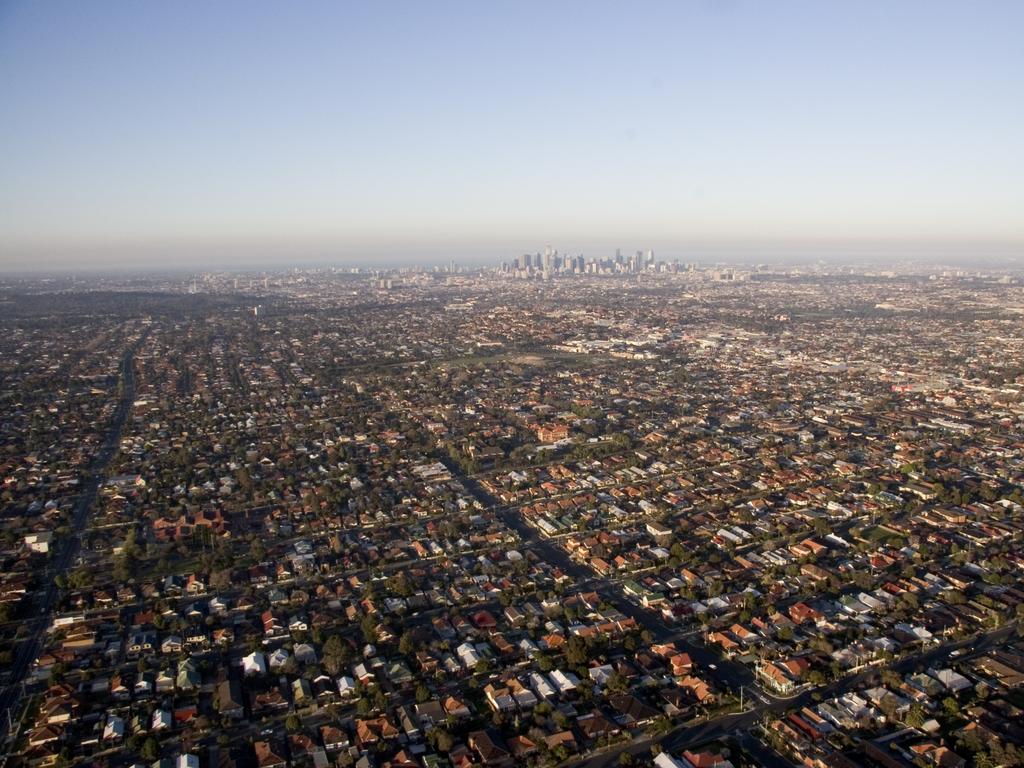
Melbourne is hardest-hit, with more than 2000 jobs lost, followed by The Rocks in Sydney, Richmond, St Kilda, Perth and Brunswick. Wage losses across these suburbs are about $2m each per week, a sizeable amount of hard cash to pull out of one suburb.
The biggest job losses in percentage terms are found in smaller regions devastated by the shutdown of tourism and travel, such as Jindabyne, Port Douglas and Mount Beauty, where at least one in eight jobs has been destroyed.
Areas faring relatively well are pretty much anywhere you find large numbers of public servants, typically in the ACT and the Northern Territory, as well as remote indigenous communities.
If you want to find a suburb that has improved its wages position since COVID-19, well, apart from some statistical glitches with virtually no employees, we’d thought we found one, but it turned out to be a light aerodrome. As far as the other 2300 suburbs are concerned, the ink is all red. This is ground zero territory for Australia, folks.
Age
The strongest indicator of economic security during the COVID crash are kids younger than 19 and, by inference, their parents. These are the two positive bumps above the line in the age chart.
When we break down families by age and child status, families where the couple are formally married, with dependent children in the home, have escaped the worst of the downturn.
If the families or individuals don’t have children, then they’re not doing that well, whatever their age. We see this here in the profiles, but we don’t pick it up in the straight descriptive stats, which are not broken down by marital status or number of kids.
Age groups hardest-hit by job losses in tourism and hospitality have been the under-30s and over-70s. The younger workers will ultimately join the ranks of the unemployed, while the older workers will tend to fade from the figures and tend to be incorrectly classed as retirees.
When the economy is once again able to generate casual jobs, especially in hospitality, the younger workers will rejoin the workforce straight away, whereas the older groups will start looking for jobs, depending on local demand in tourist regions in the bush and along the coastal strip.
The unemployment rate figures will thus tend to underestimate the real capacity for increased participation rates in the economy, especially in the regions.
Current education
Parents of schoolchildren across all sectors have been less impacted by the COVID crash than those without kids at school.
Our participation rate tables also show these parents would normally tend to have two jobs, to pay down their mortgage and pay for their kids’ education.
When we drilled further down into mortgages and incomes, we saw that the younger parents of kids normally at school are among those now seeking mortgage relief from their banks and presumably also among those seeking to draw down superannuation savings.
This reinforces the need to re-open schools, so the country can get kids back in school and their younger parents back into the workforce.
The economic benefits here for the labour market are both massive and positive. We are talking very big numbers here, of school kids, jobs, mortgages and savings.
Industry
Public sector jobs in public administration and education have escaped the COVID downturn, along with the export-driven mining sector, although the map shows some variation across the states, presumably depending on international demand for the product being mined.
Jobs across accommodation and food have been devastated by COVID restrictions, along with agriculture and fishing, manufacturing, admin consulting and arts and recreation.
The professional industries of media, finance, real estate and consulting stabilised during the second half of last month, but their performance is patchy from fortnight to fortnight.
Occupation
Occupations impacted adversely include men and women normally working as managers and farmers, salespersons, labourers and cleaners, along with female tradies and service workers.
Blue-collar workers generally haven’t been too badly impacted and the big and fast-growing group of professionals are in a similar position. The standout success story is the public sector-dominated group of male and female clerical workers.
Income
Looking across the family income ranges, we can see that the loss of casual jobs across industries and occupations in hospitality, cleaning, sales and services, has cut pay cheques to first- and second-income quartile families.
The retention of secure and well-paying public sector jobs has improved the relative position of aspirational third income quartile families along with most of those in the top income quartile.
There are signs that the very top-income families in our cities wealthiest enclaves are not doing so well and this is reflected in the interactive map.
Also worrying, for the government and the banks, is the relatively weak position of the big group called Family Part Income. This can be one in 10 families, relying on one variable income from a small business and a steadier income from a partner in a full-time salaried job. This stresses business loan repayments and causes serious flow on effects for small business employees.
Stereotypes and politics
The groups not faring well to date include those normally in digitally disrupted jobs, the younger coming-of-age workers in casual jobs, and even the normally well-to-do goat cheese circle.
Fortunately for the government, those in a secure position include swinging voter families, skilled middle-class working families and the activist Pro-Rudd group of churchgoers.
These are the three big and strategically located political building blocks Scott Morrison pinched from Labor last year.
This is a pretty good position to be in, as he starts to plan our economic recovery.
John Black pioneered demographic profiling in Australia in the 1970s and is a former Labor senator for Queensland. He is executive chairman of profiling company Australian Development Strategies and the material referred to above can be found at elaborate.net.au


Demographic and spatial modelling of the latest instalment of one-touch payroll data from the Australian Bureau of Statistics shows the biggest job losses in raw numbers are in the CBDs of our major cities, where we find recently unemployed workers in hospitality, arts and recreation.