Gold Digger: When the Feds are on your side
The US Fed’s shift to cut interest rates could provide more steam for already record gold prices, with western ETFs expected to recover.

Gold hit a new record this week ahead of US Fed rate cut
World Gold Council looking for recovery in Western ETF demand
Mithril leads the gains on silver and gold hits in Mexico
Our Gold Digger column wraps all the news driving ASX stocks with exposure to precious metals.
The rate cut cycle the market has long priced in has finally arrived as Jerome Powell delivered a one-two punch, announcing the US Federal Reserve's first cut since a hike cycle stretching back to March 2022 began on Wednesday.
It should have been manna from heaven for miners, and was in the Australian market at least, though gold prices retraced from record highs as chair Powell pulled back in his post meeting comments on calling an aggressive cutting program after the 50bps drop.
Gold is typically the biggest beneficiary when it comes to rate cuts.
The cost of holding it relative to cash declines, and if the market remains concerned about external factors like inflation, recession and war, bullion buying tends to come into vogue.
Yet prices came down from record highs as soft landing hopes led the US dollar up and stocks in the US were pared back.
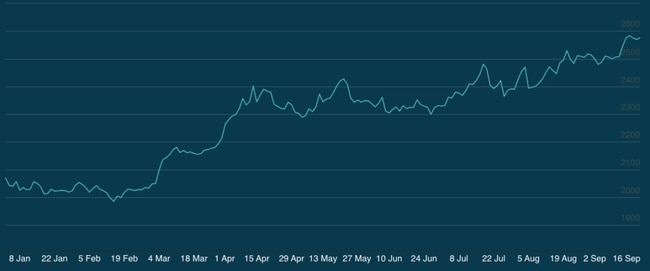
Having struck an ATH of US$2584/oz on the London market on Monday, prices by Wednesday's close were back down to US$2570/oz, before rebounding to US$2575/oz on Thursday.
That's still a gain of around 25% YTD, not something any gold miner should be unhappy about, especially with a weak Aussie dollar pinning prices for domestic producers at around $3780/oz.
Don't ETF it up
World Gold Council global head of central banks and head of Asia-Pacific ex-China Shaokai Fan said lower interest rates had the potential to bring the western ETF market back into play, a clear laggard behind central banks and eastern ETFs in gold demand in recent years.
"Lower interest rates tend to be favourable for gold, as they reduce the opportunity cost of holding the asset. While the Fed rate cut is likely already priced into various asset classes due to its well-telegraphed nature, there remains potential for increased investor interest in gold," he said.
"In particular, we may see further inflows into gold ETFs and retail gold products, especially in Western markets. This is consistent with the broader sentiment that lower rates enhance gold's appeal as a safe haven, particularly as global regulatory standards evolve, and economic uncertainty persists.
"Investors seeking diversification and capital protection in these volatile times may increasingly turn to gold, buoyed by its stability and traditional role as a hedge."
Typically gold equities have trailed the move in gold prices because, like your children, gold management teams can disappoint you.
Unlike bulk exporters such as iron ore producers, gold miners typically live on thin margins. It requires a large amount of processing to extract often imperceptible grains of gold from hard rock, meaning the gulf between the amount of ore extracted versus that which has economic value is very large.
Virtually all gold miners are also part-way refiners, operating gold rooms at the back end of their plants that pump out a ~80% pure gold dore bar, whereas other commodities miners can economically ship low-grade concentrates and even direct shipping ore.
As prices go up margins lift, but they also get chewed up as miners extend the lives of their operations by processing higher-cost ore that was previously uneconomic.
So far this year the gold miners in the All Ordinaries, the index of the top 500 companies on the ASX, are up 17.3%, trailing the gold price. But on a 12 month basis they are up a healthy 29.3%. The sub-index has around 700 points to lift to hit record levels set in August 2020, when prices hit a then record of US$2067/oz.
Winners & Losers
Here’s how ASX-listed precious metals stocks are performing:
Stocks missing from this list? Email cameron.drummond@stockhead.com.au
| CODE | COMPANY | PRICE | WEEK % | MONTH % | 6 MONTH % | YEAR % | YTD % | MARKET CAP |
|---|---|---|---|---|---|---|---|---|
| MRR | Minrex Resources Ltd | 0.0095 | 0% | 19% | -32% | -37% | -44% | $ 9,763,807.53 |
| NPM | Newpeak Metals | 0.017 | 21% | 31% | 90% | -81% | 19% | $ 5,191,886.11 |
| ASO | Aston Minerals Ltd | 0.013 | 0% | 44% | -7% | -68% | -46% | $ 16,835,835.50 |
| MTC | Metalstech Ltd | 0.175 | 6% | -5% | 9% | -3% | -20% | $ 33,465,925.11 |
| GED | Golden Deeps | 0.038 | -7% | 19% | -12% | -34% | -17% | $ 5,909,371.61 |
| G88 | Golden Mile Res Ltd | 0.009 | 0% | -10% | -18% | -76% | -53% | $ 3,701,005.70 |
| LAT | Latitude 66 Limited | 0.11 | 10% | -4% | -45% | -56% | -45% | $ 15,687,768.03 |
| NMR | Native Mineral Res | 0.021 | 0% | 0% | 5% | -60% | 5% | $ 8,365,835.60 |
| AQX | Alice Queen Ltd | 0.008 | -11% | 14% | 60% | -28% | 60% | $ 9,175,120.54 |
| SLZ | Sultan Resources Ltd | 0.006 | 0% | 0% | -54% | -77% | -73% | $ 1,185,518.93 |
| MKG | Mako Gold | 0.009 | 0% | 0% | -31% | -53% | -10% | $ 8,386,262.14 |
| KSN | Kingston Resources | 0.082 | 11% | 3% | 9% | -4% | 7% | $ 56,561,597.68 |
| AMI | Aurelia Metals Ltd | 0.175 | 9% | -3% | 25% | 75% | 59% | $ 287,565,978.94 |
| PNX | PNX Metals Limited | 0.004 | 0% | 0% | -20% | 33% | 33% | $ 23,880,859.02 |
| GIB | Gibb River Diamonds | 0.041 | 14% | 11% | 52% | 37% | 37% | $ 8,671,887.25 |
| KCN | Kingsgate Consolid. | 1.285 | 0% | -8% | 4% | 6% | -7% | $ 332,499,682.68 |
| TMX | Terrain Minerals | 0.003 | -25% | 0% | -33% | -25% | -40% | $ 5,298,086.41 |
| BNR | Bulletin Res Ltd | 0.042 | -2% | -7% | -36% | -48% | -70% | $ 12,331,759.57 |
| NXM | Nexus Minerals Ltd | 0.044 | -2% | -6% | -12% | -17% | -6% | $ 22,370,957.36 |
| SKY | SKY Metals Ltd | 0.04 | 25% | 29% | 21% | -11% | 11% | $ 24,761,232.97 |
| LM8 | Lunnonmetalslimited | 0.15 | -8% | 3% | -45% | -81% | -75% | $ 33,070,312.05 |
| CST | Castile Resources | 0.076 | 1% | 7% | 10% | 36% | -7% | $ 17,900,779.60 |
| YRL | Yandal Resources | 0.11 | -4% | -12% | 22% | 116% | 33% | $ 29,458,837.54 |
| FAU | First Au Ltd | 0.0015 | -25% | -25% | -25% | -57% | -50% | $ 2,717,989.92 |
| ARL | Ardea Resources Ltd | 0.4 | -7% | -15% | -46% | -35% | -16% | $ 81,869,995.15 |
| GWR | GWR Group Ltd | 0.08 | -2% | 0% | -24% | -16% | -16% | $ 26,339,765.71 |
| IVR | Investigator Res Ltd | 0.038 | 12% | -7% | -10% | -7% | 0% | $ 58,788,544.24 |
| GTR | Gti Energy Ltd | 0.004 | 0% | 33% | -50% | -56% | -50% | $ 12,749,735.46 |
| IPT | Impact Minerals | 0.013 | 0% | -7% | -13% | 8% | 18% | $ 39,772,638.33 |
| BNZ | Benzmining | 0.165 | 32% | 18% | 3% | -65% | -34% | $ 16,026,888.90 |
| MOH | Moho Resources | 0.006 | 0% | 50% | 0% | -25% | -40% | $ 3,235,069.18 |
| BCM | Brazilian Critical | 0.013 | -7% | -13% | -46% | -68% | -50% | $ 10,799,612.53 |
| PUA | Peak Minerals Ltd | 0.0025 | 25% | 0% | 1% | 1% | 1% | $ 3,711,612.43 |
| MRZ | Mont Royal Resources | 0.052 | 2% | -7% | -26% | -77% | -65% | $ 4,421,549.24 |
| SMS | Starmineralslimited | 0.046 | 35% | 48% | 31% | 15% | 15% | $ 3,125,852.10 |
| MVL | Marvel Gold Limited | 0.011 | 22% | 10% | 22% | 10% | -8% | $ 9,501,697.73 |
| PRX | Prodigy Gold NL | 0.002 | 0% | -10% | -44% | -72% | -62% | $ 4,235,548.97 |
| AAU | Antilles Gold Ltd | 0.003 | -25% | -25% | -83% | -87% | -87% | $ 5,567,228.18 |
| CWX | Carawine Resources | 0.094 | 4% | 3% | -10% | -13% | -15% | $ 21,723,541.31 |
| RND | Rand Mining Ltd | 1.72 | 11% | 11% | 26% | 26% | 26% | $ 92,707,816.43 |
| CAZ | Cazaly Resources | 0.014 | -7% | -18% | -22% | -66% | -52% | $ 6,458,241.87 |
| BMR | Ballymore Resources | 0.145 | 4% | 26% | 26% | 32% | 16% | $ 24,742,281.90 |
| DRE | Dreadnought Resources Ltd | 0.0155 | 3% | -14% | -9% | -71% | -48% | $ 56,070,000.00 |
| ZNC | Zenith Minerals Ltd | 0.043 | 23% | -10% | -57% | -54% | -71% | $ 15,152,377.97 |
| REZ | Resourc & En Grp Ltd | 0.025 | 14% | -4% | 150% | 56% | 79% | $ 16,728,478.05 |
| LEX | Lefroy Exploration | 0.072 | -5% | -6% | -35% | -64% | -59% | $ 15,234,844.63 |
| ERM | Emmerson Resources | 0.0495 | -1% | -8% | -3% | -24% | -16% | $ 27,235,489.40 |
| AM7 | Arcadia Minerals | 0.037 | 23% | 6% | -46% | -66% | -49% | $ 4,330,853.70 |
| ADT | Adriatic Metals | 3.32 | 10% | 10% | -11% | -11% | -17% | $ 918,153,898.32 |
| AS1 | Asara Resources Ltd | 0.016 | 60% | 33% | 78% | -36% | 60% | $ 12,350,454.90 |
| CYL | Catalyst Metals | 2.63 | 6% | 23% | 335% | 466% | 227% | $ 598,323,741.60 |
| CHN | Chalice Mining Ltd | 1.4275 | 24% | 40% | 30% | -47% | -16% | $ 571,869,378.36 |
| KAL | Kalgoorliegoldmining | 0.024 | -8% | -4% | -11% | -14% | -11% | $ 5,310,639.31 |
| MLS | Metals Australia | 0.026 | 8% | 18% | 18% | -21% | -30% | $ 17,453,268.58 |
| ADN | Andromeda Metals Ltd | 0.007 | 0% | -56% | -70% | -71% | -72% | $ 25,452,032.07 |
| MEI | Meteoric Resources | 0.1 | 0% | 0% | -57% | -61% | -62% | $ 222,247,487.66 |
| SRN | Surefire Rescs NL | 0.006 | 0% | 0% | -40% | -60% | -29% | $ 11,917,846.88 |
| WA8 | Warriedarresourltd | 0.058 | -9% | -9% | 18% | -24% | 9% | $ 44,262,139.89 |
| HMX | Hammer Metals Ltd | 0.036 | -5% | -14% | -3% | -32% | -31% | $ 31,910,664.56 |
| WCN | White Cliff Min Ltd | 0.02 | 25% | 33% | 43% | 82% | 122% | $ 32,587,748.28 |
| AVM | Advance Metals Ltd | 0.022 | -4% | 10% | -39% | -80% | -40% | $ 3,706,981.83 |
| WRM | White Rock Min Ltd | 0 | -100% | -100% | -100% | -100% | -100% | $ 17,508,200.09 |
| ASR | Asra Minerals Ltd | 0.0055 | -8% | -8% | 10% | -31% | -21% | $ 13,389,347.98 |
| MCTDB | Metalicity Limited | 0.024 | 60% | 20% | -4% | 60% | -4% | $ 8,922,525.13 |
| AME | Alto Metals Limited | 0.065 | 5% | 12% | 132% | 38% | 51% | $ 46,177,483.01 |
| CTO | Citigold Corp Ltd | 0.005 | 11% | 0% | 25% | 11% | 0% | $ 15,000,000.00 |
| TIE | Tietto Minerals | 0 | -100% | -100% | -100% | -100% | -100% | $ 773,881,054.43 |
| SMI | Santana Minerals Ltd | 2.15 | 2% | 33% | 73% | 264% | 113% | $ 449,640,351.05 |
| M2R | Miramar | 0.009 | 13% | 29% | -47% | -81% | -55% | $ 3,571,409.57 |
| MHC | Manhattan Corp Ltd | 0.001 | 0% | 0% | -60% | -85% | -70% | $ 3,092,533.34 |
| GRL | Godolphin Resources | 0.016 | 14% | 23% | -50% | -62% | -59% | $ 3,422,259.54 |
| SVG | Savannah Goldfields | 0.025 | -14% | 4% | -17% | -61% | -50% | $ 7,027,122.90 |
| EMC | Everest Metals Corp | 0.12 | 9% | 4% | 52% | -4% | 50% | $ 22,353,973.08 |
| GUL | Gullewa Limited | 0.065 | 0% | 0% | 18% | 18% | 18% | $ 13,310,251.50 |
| CY5 | Cygnus Metals Ltd | 0.075 | 10% | 36% | 50% | -62% | -44% | $ 27,724,296.97 |
| G50 | G50Corp Ltd | 0.145 | 7% | 0% | 45% | -6% | 7% | $ 17,531,950.00 |
| ADV | Ardiden Ltd | 0.135 | 0% | 13% | -18% | -48% | -23% | $ 8,439,863.31 |
| AAR | Astral Resources NL | 0.11 | 5% | 39% | 80% | 51% | 51% | $ 102,871,728.96 |
| VMC | Venus Metals Cor Ltd | 0.062 | -2% | -7% | -28% | -52% | -38% | $ 11,763,178.35 |
| NAE | New Age Exploration | 0.004 | -20% | 0% | 0% | -50% | -33% | $ 7,175,595.64 |
| VKA | Viking Mines Ltd | 0.009 | 0% | 13% | -18% | -10% | -36% | $ 9,563,325.88 |
| LCL | LCL Resources Ltd | 0.011 | -8% | 38% | -8% | -62% | -35% | $ 9,648,780.26 |
| MTH | Mithril Silver Gold | 0.33 | 214% | 154% | 65% | 65% | 65% | $ 21,130,625.51 |
| ADG | Adelong Gold Limited | 0.004 | 0% | 0% | 0% | -50% | -20% | $ 4,471,955.83 |
| RMX | Red Mount Min Ltd | 0.001 | 0% | -33% | -43% | -71% | -62% | $ 3,873,577.31 |
| PRS | Prospech Limited | 0.038 | 23% | 15% | 6% | 41% | 23% | $ 11,802,482.45 |
| TTM | Titan Minerals | 0.465 | 13% | 11% | 60% | 18% | 66% | $ 81,343,126.89 |
| NML | Navarre Minerals Ltd | 0.019 | 0% | 0% | 0% | 0% | 0% | $ 28,555,653.83 |
| AAM | Aumegametals | 0.045 | 0% | 5% | 13% | -20% | -4% | $ 25,256,147.57 |
| KZR | Kalamazoo Resources | 0.079 | -4% | 18% | -11% | -25% | -34% | $ 14,587,041.07 |
| BCN | Beacon Minerals | 0.022 | -6% | -4% | -12% | -12% | -12% | $ 86,405,667.93 |
| MAU | Magnetic Resources | 1.38 | 3% | -13% | 36% | 73% | 35% | $ 359,651,741.40 |
| BC8 | Black Cat Syndicate | 0.365 | -1% | 4% | 83% | 49% | 46% | $ 161,902,932.11 |
| EM2 | Eagle Mountain | 0.046 | 5% | -8% | -34% | -44% | -38% | $ 17,286,496.57 |
| EMR | Emerald Res NL | 3.885 | 1% | -2% | 39% | 48% | 29% | $ 2,516,128,178.41 |
| BYH | Bryah Resources Ltd | 0.005 | 0% | 25% | -55% | -69% | -62% | $ 2,516,434.28 |
| HCH | Hot Chili Ltd | 0.8 | 2% | -4% | -29% | -41% | -26% | $ 115,079,542.00 |
| WAF | West African Res Ltd | 1.6825 | 21% | 17% | 60% | 98% | 78% | $ 1,866,579,072.44 |
| MEU | Marmota Limited | 0.036 | -3% | -10% | -20% | 6% | -16% | $ 39,116,820.67 |
| NVA | Nova Minerals Ltd | 0.16 | 3% | 0% | -40% | -35% | -56% | $ 38,969,100.96 |
| SVL | Silver Mines Limited | 0.096 | 2% | 20% | -36% | -48% | -40% | $ 149,295,589.44 |
| PGD | Peregrine Gold | 0.15 | -9% | -29% | -35% | -50% | -38% | $ 10,181,763.15 |
| ICL | Iceni Gold | 0.035 | 0% | -17% | 52% | -62% | -33% | $ 10,092,158.92 |
| FG1 | Flynngold | 0.029 | 12% | 16% | -26% | -45% | -36% | $ 7,137,661.16 |
| WWI | West Wits Mining Ltd | 0.016 | 7% | 7% | 14% | 7% | 33% | $ 40,667,629.02 |
| RML | Resolution Minerals | 0.002 | 0% | 0% | -33% | -60% | -33% | $ 3,220,043.61 |
| AAJ | Aruma Resources Ltd | 0.017 | -23% | 21% | -6% | -51% | -37% | $ 3,997,047.10 |
| AL8 | Alderan Resource Ltd | 0.003 | 0% | 12% | -25% | -58% | -33% | $ 3,818,583.92 |
| GMN | Gold Mountain Ltd | 0.003 | -14% | -14% | -25% | -57% | -45% | $ 11,722,419.55 |
| MEG | Megado Minerals Ltd | 0.016 | 45% | 60% | 45% | -58% | -54% | $ 3,816,833.37 |
| HMG | Hamelingoldlimited | 0.064 | -12% | -53% | -14% | -25% | -19% | $ 10,080,000.00 |
| TBA | Tombola Gold Ltd | 0 | -100% | -100% | -100% | -100% | -100% | $ 33,129,242.98 |
| BM8 | Battery Age Minerals | 0.115 | -8% | 15% | -8% | -63% | -39% | $ 11,628,017.50 |
| TBR | Tribune Res Ltd | 4.42 | 14% | 8% | 23% | 34% | 50% | $ 230,859,538.80 |
| FML | Focus Minerals Ltd | 0.14 | -3% | 0% | -22% | -18% | -24% | $ 40,118,210.30 |
| GSR | Greenstone Resources | 0 | -100% | -100% | -100% | -100% | -100% | $ 15,761,980.01 |
| VRC | Volt Resources Ltd | 0.004 | 0% | 33% | -20% | -47% | -38% | $ 16,634,712.51 |
| ARV | Artemis Resources | 0.011 | -8% | -27% | -37% | -69% | -42% | $ 24,919,471.54 |
| HRN | Horizon Gold Ltd | 0.34 | -1% | 19% | 17% | 1% | 13% | $ 49,245,573.82 |
| CLA | Celsius Resource Ltd | 0.012 | 9% | 0% | -20% | 9% | 0% | $ 29,134,952.92 |
| QML | Qmines Limited | 0.097 | 18% | 70% | 39% | -1% | 18% | $ 25,512,614.48 |
| RDN | Raiden Resources Ltd | 0.04 | 33% | 67% | 60% | 14% | 0% | $ 100,196,780.83 |
| TCG | Turaco Gold Limited | 0.28 | 6% | 12% | 70% | 383% | 115% | $ 206,443,226.28 |
| KCC | Kincora Copper | 0.046 | -8% | -6% | 48% | 24% | 12% | $ 9,475,223.38 |
| GBZ | GBM Rsources Ltd | 0.008 | 0% | -11% | -11% | -53% | -11% | $ 9,253,511.11 |
| DTM | Dart Mining NL | 0.0155 | 3% | 13% | 13% | -37% | -1% | $ 4,845,616.35 |
| MKR | Manuka Resources. | 0.036 | 3% | 33% | -51% | -22% | -53% | $ 24,952,565.41 |
| AUC | Ausgold Limited | 0.43 | 8% | 18% | 39% | 23% | 34% | $ 153,201,031.24 |
| ANX | Anax Metals Ltd | 0.02 | 0% | 0% | -9% | -63% | -33% | $ 14,586,659.93 |
| EMU | EMU NL | 0.024 | 0% | 14% | -13% | -71% | -13% | $ 3,262,978.86 |
| SFM | Santa Fe Minerals | 0.038 | 0% | 3% | -16% | -14% | -12% | $ 2,767,113.98 |
| SSR | SSR Mining Inc. | 8.51 | 8% | 12% | 38% | -63% | -46% | $ 34,230,516.44 |
| PNR | Pantoro Limited | 0.12 | 4% | 20% | 107% | 161% | 111% | $ 774,483,661.68 |
| CMM | Capricorn Metals | 6.43 | 13% | 8% | 29% | 44% | 37% | $ 2,397,302,996.85 |
| X64 | Ten Sixty Four Ltd | 0.57 | 0% | 0% | 0% | 0% | 0% | $ 129,844,903.32 |
| SI6 | SI6 Metals Limited | 0.0015 | -25% | -25% | -57% | -83% | -70% | $ 4,737,718.85 |
| HAW | Hawthorn Resources | 0.056 | -8% | -8% | -20% | -53% | -40% | $ 20,100,936.78 |
| BGD | Bartongoldholdings | 0.245 | 4% | -2% | -14% | 17% | -8% | $ 53,571,435.89 |
| SVY | Stavely Minerals Ltd | 0.03 | 3% | 15% | 0% | -59% | -33% | $ 15,409,293.57 |
| AGC | AGC Ltd | 0.23 | -13% | -22% | 229% | 297% | 224% | $ 67,998,263.83 |
| RGL | Riversgold | 0.004 | 0% | -20% | -50% | -67% | -67% | $ 6,637,312.97 |
| TSO | Tesoro Gold Ltd | 0.033 | 27% | 18% | 14% | 65% | 14% | $ 45,407,421.24 |
| GUE | Global Uranium | 0.056 | -5% | 4% | -49% | -66% | -43% | $ 15,941,234.10 |
| CPM | Coopermetalslimited | 0.055 | -19% | -24% | -59% | -62% | -84% | $ 4,309,560.75 |
| MM8 | Medallion Metals. | 0.056 | 8% | 2% | 0% | -16% | -14% | $ 20,405,179.19 |
| FFM | Firefly Metals Ltd | 1.0525 | 20% | 20% | 70% | 80% | 67% | $ 495,129,200.86 |
| CBY | Canterbury Resources | 0.034 | 3% | -6% | 3% | 26% | 36% | $ 6,712,990.46 |
| LYN | Lycaonresources | 0.325 | 33% | 27% | 86% | 7% | 63% | $ 17,749,915.71 |
| SFR | Sandfire Resources | 9.095 | 2% | 4% | 7% | 42% | 24% | $ 4,190,203,024.20 |
| TMZ | Thomson Res Ltd | 0.005 | 0% | 0% | 0% | 0% | 0% | $ 4,881,018.47 |
| TAM | Tanami Gold NL | 0.032 | 3% | 3% | -3% | -20% | -9% | $ 37,603,105.47 |
| WMC | Wiluna Mining Corp | 0 | -100% | -100% | -100% | -100% | -100% | $ 74,238,030.68 |
| NWM | Norwest Minerals | 0.02 | 0% | -9% | -20% | -39% | -26% | $ 8,732,151.18 |
| ALK | Alkane Resources Ltd | 0.45 | 11% | 3% | -22% | -29% | -31% | $ 259,969,301.10 |
| BMO | Bastion Minerals | 0.006 | 0% | 0% | -45% | -74% | -67% | $ 3,039,074.51 |
| IDA | Indiana Resources | 0.094 | 0% | 3% | 18% | 43% | 18% | $ 60,265,271.22 |
| GSM | Golden State Mining | 0.011 | 10% | 0% | 10% | -72% | -27% | $ 3,073,076.93 |
| NSM | Northstaw | 0.014 | -30% | -7% | -64% | -59% | -72% | $ 1,958,260.98 |
| GSN | Great Southern | 0.017 | -15% | 6% | -23% | -23% | -11% | $ 14,374,922.87 |
| RED | Red 5 Limited | 0.3325 | 9% | -6% | -5% | 25% | 7% | $ 2,244,816,216.06 |
| DEG | De Grey Mining | 1.3425 | 17% | 8% | 13% | 5% | 9% | $ 3,115,784,756.50 |
| THR | Thor Energy PLC | 0.017 | 13% | 13% | -32% | -62% | -43% | $ 3,914,645.57 |
| CDR | Codrus Minerals Ltd | 0.023 | 5% | -12% | -48% | -75% | -59% | $ 3,803,912.59 |
| MDI | Middle Island Res | 0.02 | 82% | 67% | 25% | 11% | 25% | $ 3,931,212.37 |
| WTM | Waratah Minerals Ltd | 0.365 | -5% | -1% | 421% | 836% | 204% | $ 74,588,310.18 |
| POL | Polymetals Resources | 0.27 | 8% | 8% | -4% | -18% | -13% | $ 50,637,772.90 |
| RDS | Redstone Resources | 0.0035 | -13% | -13% | -13% | -50% | -42% | $ 3,238,824.61 |
| NAG | Nagambie Resources | 0.023 | 35% | 53% | 77% | -4% | -21% | $ 15,932,713.54 |
| BGL | Bellevue Gold Ltd | 1.2875 | 10% | -6% | -30% | -16% | -23% | $ 1,606,398,728.69 |
| GBR | Greatbould Resources | 0.048 | 7% | 2% | -20% | -23% | -26% | $ 29,169,425.42 |
| KAI | Kairos Minerals Ltd | 0.012 | 33% | 20% | -14% | -45% | -14% | $ 34,201,858.46 |
| KAU | Kaiser Reef | 0.15 | 3% | 0% | 30% | -19% | -12% | $ 29,644,364.63 |
| HRZ | Horizon | 0.043 | -2% | 5% | 23% | 5% | 2% | $ 48,098,041.39 |
| CAI | Calidus Resources | 0.115 | 0% | 0% | -30% | -34% | -47% | $ 93,678,205.58 |
| CDT | Castle Minerals | 0.0035 | -13% | -13% | -42% | -68% | -63% | $ 4,118,442.32 |
| RSG | Resolute Mining | 0.7175 | 3% | 5% | 89% | 102% | 61% | $ 1,543,561,259.43 |
| MXR | Maximus Resources | 0.032 | -3% | 3% | 6% | 17% | -6% | $ 13,693,686.11 |
| EVN | Evolution Mining Ltd | 4.435 | 10% | 5% | 30% | 20% | 12% | $ 8,752,556,881.20 |
| CXU | Cauldron Energy Ltd | 0.021 | 5% | 17% | -46% | 94% | -13% | $ 25,757,143.25 |
| DLI | Delta Lithium | 0.205 | 0% | -2% | -36% | -74% | -56% | $ 149,815,499.82 |
| ALY | Alchemy Resource Ltd | 0.007 | 17% | 17% | -13% | -36% | -30% | $ 7,068,457.54 |
| HXG | Hexagon Energy | 0.023 | 10% | 53% | -15% | 156% | 92% | $ 11,797,065.72 |
| OBM | Ora Banda Mining Ltd | 0.635 | 11% | 31% | 149% | 429% | 165% | $ 1,182,546,581.44 |
| AVW | Avira Resources Ltd | 0.001 | 0% | 0% | 0% | -33% | -50% | $ 2,938,790.00 |
| LCY | Legacy Iron Ore | 0.013 | 0% | -7% | -7% | -13% | -24% | $ 100,276,127.41 |
| PDI | Predictive Disc Ltd | 0.27 | 0% | 13% | 17% | 20% | 29% | $ 646,498,045.33 |
| MAT | Matsa Resources | 0.037 | 28% | 37% | 32% | 28% | 42% | $ 21,452,887.60 |
| ZAG | Zuleika Gold Ltd | 0.014 | 0% | 8% | -22% | 17% | -22% | $ 10,372,318.98 |
| GML | Gateway Mining | 0.025 | 14% | 14% | 0% | -22% | 0% | $ 10,281,945.05 |
| SBM | St Barbara Limited | 0.2975 | 21% | 21% | 75% | 49% | 42% | $ 233,227,318.67 |
| SBR | Sabre Resources | 0.014 | 8% | 8% | -22% | -70% | -58% | $ 5,501,467.06 |
| STK | Strickland Metals | 0.093 | -7% | -19% | 8% | 79% | -2% | $ 207,449,985.75 |
| ION | Iondrive Limited | 0.014 | -7% | 56% | 56% | 8% | 17% | $ 9,919,105.01 |
| CEL | Challenger Gold Ltd | 0.057 | 27% | 21% | -30% | -34% | -23% | $ 71,593,007.66 |
| LRL | Labyrinth Resources | 0.02 | 50% | 103% | 417% | 374% | 306% | $ 30,437,671.81 |
| NST | Northern Star | 15.945 | 6% | 10% | 15% | 40% | 17% | $ 18,168,561,348.96 |
| OZM | Ozaurum Resources | 0.04 | 11% | -18% | -23% | -56% | -73% | $ 6,350,000.00 |
| TG1 | Techgen Metals Ltd | 0.035 | -5% | 9% | 9% | 0% | -55% | $ 4,484,639.88 |
| XAM | Xanadu Mines Ltd | 0.055 | 4% | -2% | -4% | -40% | -7% | $ 94,380,330.50 |
| AQI | Alicanto Min Ltd | 0.023 | 28% | 53% | -16% | -39% | -30% | $ 17,207,288.13 |
| KTA | Krakatoa Resources | 0.012 | 9% | 20% | 20% | -45% | -67% | $ 5,665,286.64 |
| ARN | Aldoro Resources | 0.081 | 1% | 11% | 4% | -30% | -35% | $ 10,904,523.18 |
| WGX | Westgold Resources. | 2.7 | -4% | -10% | 13% | 44% | 24% | $ 2,527,533,969.20 |
| MBK | Metal Bank Ltd | 0.014 | 0% | -18% | -39% | -60% | -48% | $ 5,856,889.37 |
| A8G | Australasian Metals | 0.11 | -8% | -8% | 55% | -27% | -35% | $ 5,733,254.34 |
| TAR | Taruga Minerals | 0.0085 | 6% | 21% | 6% | -6% | -23% | $ 5,648,214.28 |
| DTR | Dateline Resources | 0.005 | 0% | -29% | -69% | -64% | -50% | $ 12,473,399.31 |
| GOR | Gold Road Res Ltd | 1.665 | 7% | -9% | 7% | -3% | -15% | $ 1,787,518,528.95 |
| S2R | S2 Resources | 0.084 | -5% | -20% | -33% | -52% | -49% | $ 37,587,213.42 |
| NES | Nelson Resources. | 0.003 | 0% | 0% | 0% | -40% | -25% | $ 1,840,782.98 |
| TLM | Talisman Mining | 0.22 | 5% | 5% | 22% | 57% | -6% | $ 39,547,273.29 |
| BEZ | Besragoldinc | 0.075 | -16% | -29% | -44% | -46% | -50% | $ 33,239,116.08 |
| PRU | Perseus Mining Ltd | 2.625 | 12% | 4% | 26% | 47% | 42% | $ 3,619,396,829.19 |
| SPQ | Superior Resources | 0.007 | -22% | 0% | -29% | -74% | -46% | $ 15,189,046.59 |
| PUR | Pursuit Minerals | 0.0025 | -17% | 0% | -50% | -72% | -69% | $ 7,270,799.97 |
| RMS | Ramelius Resources | 2.21 | 3% | 6% | 37% | 51% | 31% | $ 2,514,206,290.38 |
| PKO | Peako Limited | 0.003 | 0% | -14% | -22% | -35% | -22% | $ 2,635,424.60 |
| ICG | Inca Minerals Ltd | 0.005 | -17% | 25% | -17% | -71% | -52% | $ 4,066,093.45 |
| A1G | African Gold Ltd. | 0.041 | 11% | 71% | 30% | 15% | 78% | $ 14,358,380.80 |
| OAU | Ora Gold Limited | 0.007 | 17% | 40% | 27% | -13% | 0% | $ 50,001,242.42 |
| GNM | Great Northern | 0.013 | -7% | 18% | -13% | -46% | -35% | $ 2,010,178.00 |
| KRM | Kingsrose Mining Ltd | 0.0345 | -4% | -8% | 8% | -37% | -16% | $ 26,373,428.17 |
| BTR | Brightstar Resources | 0.018 | 6% | 13% | 6% | 50% | 13% | $ 106,360,024.54 |
| RRL | Regis Resources | 2.005 | 12% | 24% | 9% | 24% | -8% | $ 1,473,181,581.30 |
| M24 | Mamba Exploration | 0.012 | -33% | 33% | -52% | -79% | -76% | $ 2,633,151.86 |
| TRM | Truscott Mining Corp | 0.07 | 17% | 17% | 50% | 47% | 28% | $ 12,809,899.20 |
| TNC | True North Copper | 0.033 | -3% | -15% | -52% | -81% | -66% | $ 31,517,647.13 |
| MOM | Moab Minerals Ltd | 0.004 | -20% | -20% | -20% | -67% | -43% | $ 3,175,256.95 |
| KNB | Koonenberrygold | 0.009 | -10% | -31% | -50% | -71% | -77% | $ 2,877,874.74 |
| AWJ | Auric Mining | 0.315 | 11% | 24% | 103% | 600% | 163% | $ 46,794,311.87 |
| ENR | Encounter Resources | 0.43 | -5% | -11% | 76% | 39% | 48% | $ 192,026,922.95 |
| SNG | Siren Gold | 0.07 | 17% | -4% | 25% | -4% | 3% | $ 14,294,998.69 |
| STN | Saturn Metals | 0.265 | 26% | 39% | 47% | 66% | 56% | $ 78,765,645.42 |
| USL | Unico Silver Limited | 0.2125 | 21% | 9% | 85% | 117% | 70% | $ 71,977,636.31 |
| PNM | Pacific Nickel Mines | 0.024 | 0% | 0% | -40% | -72% | -71% | $ 10,103,834.52 |
| AYM | Australia United Min | 0.002 | 0% | 0% | -33% | -33% | -33% | $ 3,685,154.97 |
| ANL | Amani Gold Ltd | 0.001 | 0% | 0% | 0% | 0% | 0% | $ 25,743,441.13 |
| HAV | Havilah Resources | 0.18 | 0% | -8% | 16% | -25% | -8% | $ 58,578,253.85 |
| SPR | Spartan Resources | 1.41 | 1% | 6% | 141% | 269% | 173% | $ 1,449,983,830.66 |
| PNT | Panthermetalsltd | 0.018 | 13% | -11% | -32% | -62% | -57% | $ 2,091,987.89 |
| MEK | Meeka Metals Limited | 0.057 | 14% | 6% | 58% | 14% | 43% | $ 82,717,041.12 |
| GMD | Genesis Minerals | 2.17 | 1% | 0% | 15% | 37% | 21% | $ 2,392,317,408.96 |
| PGO | Pacgold | 0.12 | 46% | 20% | -17% | -43% | -37% | $ 10,097,452.80 |
| FEG | Far East Gold | 0.17 | -3% | 3% | 36% | -3% | 36% | $ 48,471,273.46 |
| MI6 | Minerals260Limited | 0.135 | 4% | 23% | -16% | -74% | -58% | $ 31,590,000.00 |
| IGO | IGO Limited | 5.065 | -8% | 2% | -35% | -61% | -44% | $ 3,937,792,627.60 |
| GAL | Galileo Mining Ltd | 0.16 | 0% | -3% | -33% | -49% | -44% | $ 32,608,112.96 |
| RXL | Rox Resources | 0.135 | -4% | -4% | -18% | -37% | -27% | $ 57,483,340.18 |
| PTN | Patronus Resources | 0.052 | 2% | -5% | -19% | 33% | -22% | $ 85,144,685.81 |
| CLZ | Classic Min Ltd | 0.001 | 0% | 0% | -98% | -98% | -98% | $ 1,439,025.56 |
| TGM | Theta Gold Mines Ltd | 0.165 | 18% | 10% | 10% | 32% | 43% | $ 128,811,767.04 |
| FAL | Falconmetalsltd | 0.195 | -15% | -32% | 77% | 50% | 34% | $ 35,400,000.00 |
| SXG | Southern Cross Gold | 2.92 | 3% | 13% | 43% | 244% | 132% | $ 565,572,821.40 |
| SPD | Southernpalladium | 0.375 | 3% | -1% | 10% | -23% | 0% | $ 33,656,250.00 |
| ORN | Orion Minerals Ltd | 0.016 | 7% | 0% | 23% | -11% | 14% | $ 109,372,335.41 |
| TMB | Tambourahmetals | 0.035 | 9% | -8% | -55% | -82% | -69% | $ 3,510,019.15 |
| TMS | Tennant Minerals Ltd | 0.016 | -6% | -24% | -45% | -50% | -52% | $ 15,294,246.64 |
| AZY | Antipa Minerals Ltd | 0.0215 | 54% | 95% | 79% | 79% | 26% | $ 100,142,687.99 |
| PXX | Polarx Limited | 0.009 | -10% | 0% | -36% | 3% | 32% | $ 21,379,508.80 |
| TRE | Toubani Res Ltd | 0.255 | 4% | 42% | 113% | 96% | 76% | $ 55,927,066.78 |
| AUN | Aurumin | 0.04 | -2% | 11% | 11% | 60% | 54% | $ 18,229,729.76 |
| GPR | Geopacific Resources | 0.025 | 4% | 9% | 47% | 47% | 25% | $ 25,171,364.57 |
| FXG | Felix Gold Limited | 0.089 | -1% | 141% | 218% | 13% | 82% | $ 22,486,713.48 |
| ILT | Iltani Resources Lim | 0.235 | 12% | 31% | 68% | 24% | 47% | $ 8,672,678.78 |
| BRX | Belararoxlimited | 0.24 | -4% | -13% | 12% | -62% | -23% | $ 26,150,470.00 |
| TM1 | Terra Metals Limited | 0.038 | 12% | -12% | -25% | -33% | -17% | $ 13,852,254.29 |
| TOR | Torque Met | 0.089 | -19% | -19% | -41% | -74% | -60% | $ 18,843,892.60 |
| ARD | Argent Minerals | 0.0175 | 3% | 25% | 94% | 46% | 94% | $ 25,268,699.16 |
Top ASX Gold Stories This Week
$31 million capped Mithril Silver and Gold (ASX:MTH) is up ~135% over the past month, with all of that gain coming in an extraordinary week that has seen it run hot on exploration announcements from the Copalquin project in Mexico.
Its conviction is that the district under MTH’s future control, once an option to acquire the project is exercised, can mirror others along Mexico’s plentiful Sierra Madre trend.
MD John Skeet is hoping to double the size of its El Refugio resource by early next year, after clocking the highest grade intercept to date from the project, striking 33m from surface at 31.8g/t gold and 274g/t silver.
“Hole CDH-159 is a globally significant >1,000 g/t AuEq1 x metre drill hole at the maiden resource Target 1 area where we aim to 2X the (529koz @6.81 g/t AuEq1 ) resource in Q1 2025,” he said.
“The intercept includes a zone of lower grade material from surface plus a very high-grade zone from 16 metres down hole, including the typical bonanza gold and silver grades that are a hallmark of this important mining district."
Middle Island Resources (ASX:MDI) shares have been climbing as well. On what, it's anyone's guess. The explorer, once part of the consolidation story in the Sandstone gold field of WA when it was run by Rick Yeates, has punched some thus far fruitless holes into its Barkly copper and gold project in the Northern Territory. The targets are named after Flintstones characters though, so we hope there's some success on the horizon and we can one day head down the Dino decline.
It was most recently seen selling ~$1.4 million worth of shares in fellow explorer Aurumin (ASX:AUN) to raise some cash.
Antipa Minerals (ASX:AZY) shares have been on the up as the junior goldie emerged as a key cog in the consolidation of the Paterson Province.
It's cashed up after selling its minority stake in a JV to Rio Tinto (ASX:RIO)last week. But it was also an interesting pawn in the chess match between Newmont and Greatland Gold over the London-listed explorer's US$475 million acquisition of the Telfer gold mine and Havieron JV.
The deal also saw Greatland pick up Newmont's 8.6% stake in Antipa, which on Tuesday added 573,000oz to take its gold resource at the Minyari Dome project 33% higher to 2.3Moz. AZY also controls 83,500t copper, 661,000oz silver and 13,000t cobalt at the WA gold deposit.
Telfer wasn't the only gold M&A turning heads, with South African giant AngloGold Ashanti also announcing a US$2.5 billion takeover comprising both shares and cash for Egyptian gold producer Centamin, while IGO (ASX:IGO) was rumoured to be considering a move back into the precious metal, spying off Rio's large but thus far undeveloped Winu discovery to Telfer's north.
At Stockhead, we tell it like it is. While Mithril Silver and Gold and Antipa Minerals were Stockhead advertisers at the time of writing, they did not sponsor this article.

Mining and tech stocks lead as Mithril strikes gold
The ASX touched a record high, driven by the tech sector rally. There was also some impressive drilling results from Mithril in Mexico.

ASX health stocks fall but momentum returning
ASX health stocks have fallen this week but Morgans analyst Scott Power is more optimistic after the US Federal Reserve cut the cash rate by 50bps.