The now-or-never years: This century’s single person household surge
The early decades of the 21st century show that for many people it’s all about being sufficiently agile to move from singledom to coupledom and back to single life. That’s what Australians want.


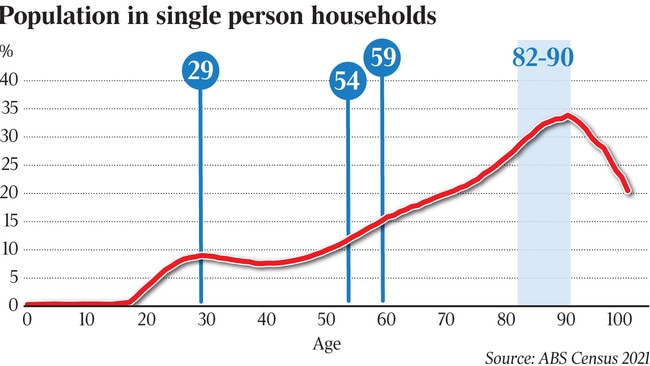
This is far from a simple line chart. It is a graphic representation of one of the most powerful social forces shaping the fabric of Australian cities in the 21st century. The chart tracks the proportion of the population living alone by single year of age at the 2021 census.
In 2001, the number of people living in single person households was 1.6 million, or 24 per cent of all households. By 2021, the number of single person households had jumped to 2.6 million, or 26 per cent.
Single-person households jumped 62 per cent over these years and captured a further two percentage points in market share of all households. No other household type could match the quantum of this land (and household) grab. What caused it, and will it continue?
The demand driver behind what has been a profound uplift in single person households may be collectively summarised as changed social behaviour and migration/visa policies.
This includes Australia’s relentless pursuit of the international student market, the postponement of commitment to marriage from early-20s to late-20s, thus extending the period of singledom, greater social acceptance of the freedom to end unhappy relationships (leading to separation and divorce), and increased life expectancy.
Projections released by the Australian Bureau of Statistics in June 2024 show that, over the 20 years to 2041, most net new households will be added to households headed by a single person (up 947,800).
A close second is couple households without children (up 860,300). Family households (couples with kids) are expected to jump by 799,000 over this time frame. And one-parent families are expected to increase by 381,000 over the 20 years to 2041.
Interestingly, the official outlook is for more net growth in households without children (including couples, singles), up 1.9 million, than for households with children (couple-with-kids, one-parent families), up 1.2 million.
However, perhaps the most telling aspect of the line chart is what it reveals about the shape of single life in Australia.
Peak single life is reached at age 29, when 9 per cent of people remain single. Thereafter, single life subsides, presumably in favour of coupledom and (perhaps) children.
The time in the life cycle when single life is most consistently eschewed by Australians is 38-41, when just 7.6 per cent of the population remain single. This generally coincides with the time when children are preschool or at least pre-secondary school.
However, during the 40s and across the 50s a different kind of thinking drives behaviour: living singly becomes progressively popular and is most likely due to a preference at this time for separation and divorce.
Interestingly, there is a discernible statistical bump at age 54 when the proportion of singles jumps by almost a full percentage point (of the population in that age group) and again at 59, when there’s another lurch towards singledom. At this time in the life cycle, singles generally expand by 300-400 from one year to the next at an Australia-wide level.
However, in these key years (54 and 59), in these now-or-never years, the net growth in single person households is between 1500 and 2000 a year.

It’s almost as if people make life decisions around key milestones: commit to a relationship (if you haven’t already found one) after age 29; make a decision to end a relationship at 54 when retirement planning and/or rest-of-life planning becomes necessary; or simply end a relationship that isn’t working at age 59.
Outside these now-or-never years (29, 54, 59) the surge towards singledom ratchets up between the ages of 82 and 90 when singledom (and, sadly, loneliness) is imposed by the loss of a life partner. From the age of 91 onwards, fewer people live singly, but rather opt for an assisted living arrangement of some sort.
The important takeaway from this analysis is the role of milestone years in triggering a change in circumstances and perhaps in housing arrangements. Apartments suitable for older singles should therefore be marketed to people in their mid to late-50s.
And while there is always a market for young first home buyers in their early-20s, the evidence is that there’s a whole lot of partnering that takes place from age 30 onwards. And these 30-something couples are more likely to afford a “forever home” suitable for children.
If the middle decades of the 20th century were all about suburbia and the family, the early decades of the 21st century offers a different narrative.
It’s all about being sufficiently agile to move from singledom to coupledom and back to single life. Rightly or wrongly, that’s what people want, according to my simple, single line chart.
Bernard Salt is founder and executive director of The Demographics Group; data by data scientist and corporate speaker Hari Hara Priya Kannan
More Coverage


Add your comment to this story
Housing: Don’t bank on a rate cut
Mortgage holders and hopeful home buyers have been warned against banking on an interest rate cut.

Roberts Co administrator seeks a site restart
Builder Roberts Co’s Victorian arm has shut down its big jobs but administrator McGrathNicol says it can get projects back on track and it will have to break them up for the best result.
To join the conversation, please log in. Don't have an account? Register
Join the conversation, you are commenting as Logout