Red state, blue state: Australia’s split future
What have the Australian people done with their vast continent thus far in the 21st century? It is an important question.

What have the Australian people done with their vast continent thus far in the 21st century? It is an important question. It goes to the core of our Australianness, to the way we think, to the priorities and to the values we hold dear. All this and more is evident in a single map that underpins the demand for property, and not just within the regions.
Let me explain.
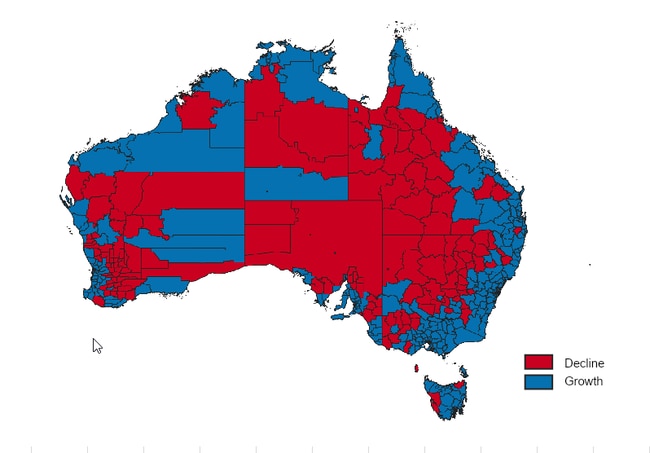
In the map pictured here, I show areas of (net) population growth (blue) and loss (red) between the year 2000 and 2023. The data is sourced from the Australian Bureau of Statistics, with trend adjustments from 2001 data to 2000. The geographic basis to the data is the 540 local government areas that comprise the Australian continent. I have labelled LGAs that I found interesting.
This exercise shows that over the first 23 years of the 21st century, Australia added 7.6 million net extra residents to reach a new base of 26.6 million at June 2023. The population in May 2024 is closer to 27.3 million. The official (medium) projection is for Australia to reach a population of 30 million by 2033, although I think this figure will be closer to 32 million.
Just to put this in perspective, if Australia was the 51st state of the US, we would rank between Texas (31 million) and Florida (23 million). California is No. 1 with 39 million (and falling).
Based on our growth history and commitment to immigration, Australia will require more residential and commercial property, and more urban infrastructure, for decades to come.
My red and blue map effectively distils the collective will of the Australian people over almost a quarter of a century. This is no patchwork of individual states, all going their own way. Instead, it shows a concentration of the Australian people on the coast and, apart from some mining communities, population losses from much of the interior.
Indeed, this map shows that the Australian people are united in the singular pursuit of a suburban, a sea-change or a treechange lifestyle and preferably within convenient driving distance of a capital city job market.
Closer inspection of the dataset shows that over these years, Australians (including, for example, Millennials) have clustered within municipalities containing the capital city CBD. Here is yet another lifestyle iteration (ie “inner-city-living”) that has been increasingly pursued by Australians and which requires a property response.
These macro trends underpinning demand for much of the Australian property market are evident in the dataset developed to produce the blue and red growth/loss map of Australia.
Most population growth over the 23 years to 2023 has focused on the suburbs of capital cities in places such as Melbourne’s Wyndham up 241,058, or 290 per cent, Sydney’s Blacktown up 166,986 (64 per cent), and Brisbane’s Moreton Bay up 235,276 (86 per cent). Middle Australia is burgeoning in middle and outer suburbia.
Within the capital-city-abutting lifestyle zone most growth over these years has concentrated in places such as the Gold Coast up 300,793, or 82 per cent, Geelong up 94,402 (50 per cent), and SA’s Onkaparinga up 31,267 (21 per cent).
And for those in pursuit of an inner-city lifestyle most population growth at this time was focused on places like the municipalities of Melbourne up 126,598 or 249 per cent, Sydney up 109,243 (90 per cent), and Perth up 23,033 (234 per cent).
These are transformative numbers: places doubling and tripling in population within a two-decade stretch suggest that recent times have been a good time to be in Australian property development.
However, there is so much more to this data set that tracks the rise and fall of Australia’s favoured living and working places early in the 21st century. The population of bauxite-producing Weipa doubled from 2,026 in 2000 to 4,251 in 2023. How has a small, remote community managed to accommodate twice the population within a single generation?
The same question about housing supply might be put to the Shire of Mapoon, near Cooktown, where the population has increased by 136 per cent over 23 years. This growth is off a small base in 2000 (pop 197) but even so a doubling of population requires a unique property solution.
And then there are communities that simply do not behave like their surrounding peers. Take, for example, the municipalities of Burdekin and Hinchinbrook, near Cairns, where today’s population levels are between 7-10 per cent below 2000 levels.
Has this demographic diminution resulted in reduced demand for housing and if so, has there been a corresponding uptick in value-for-money property today? And especially when it is evident that Burdekin and Hinchinbrook are the only municipalities fronting the eastern seaboard that have lost population in the 21st century.
The same logic applies to the Shire of Kyogle in the Northern Rivers of NSW. Here is a community that has lost 3 per cent of its population over the 23 years to 2023. There cannot have been growth pressures on property prices in a market that has remained stable for two decades. And yet everything around Kyogle is growing. Does Kyogle present as an opportunity for savvy developers?
On the west coast, the Shire of Manjimup stands out as a contracting coastal community positioned with a burgeoning region of population growth and property demand. The number of Manjimup residents in 2023 is 10 per cent below the number that lived there in 2000. Maybe Manjimup is a place to look for a weekender from Perth?
Mining and administrative communities continue to act as “growth islands” within an otherwise (demographically) thinning interior. The West’s municipalities of Laverton, Menzies and Kalgoorlie-Boulder all contain more population today than in 2000. Indeed, Menzies is up 58 per cent over 23 years, which I assume is somehow connected to mining.
The population of the vast Shire of MacDonnell which envelops Alice Springs is up just 2 per cent over 23 years. The population of East Pilbara Shire which includes the mining settlement of Newman is up 93 per cent in 23 years. Again, how does a community of barely 5000 permanent residents in the year 2000 effectively double its housing supply in 20 years to support a population today of 10,000?
And then there are the so-called “sponge cities” which very much appear to soak up the population of the surrounding farmlands. The best examples of this trend include Horsham, Griffith, Woodanilling, Cloncurry, Doomadgee and maybe Port Augusta.
The forces coalescing to produce this sponge effect include farm aggregation (to achieve economies of scale) as well the ageing of baby boomer farmers looking for an exit strategy.
Older farmers sell out to an often corporatising and upscaling neighbour and then these later-life farmers move to the nearest major town such as Horsham or Griffith or Port Augusta. I would expect this process of farmers retiring into towns to continue well into the 2030s.
The question that flows from the map is whether the behavioural patterns that shaped the property market over the past quarter of a century will continue.
I say broadly yes to greater demand for residential property in suburbia and across the lifestyle zones. And the reason is that these places excel in delivering safety, security, amenity and lifestyle. Australians will not change their core values. What may be different in the post-pandemic world is the scale and pace of demand for inner-city living. This is partly due to WFH, but it is also because the generation of workers will, I think, happily trade workplace proximity for affordability, space and amenity.
A simple red and blue map based on datapoints for 540 municipalities across a quarter of a century speaks to core Australian values. We are not so much a singularly suburban people, anymore. We have evolved, changed, learnt new tricks during the lockdowns, and we are now boldly re-imagining how, where and in what kind of property, we want to live. My red and blue map is a good place to start a strategic conversation about the future of the property industry.
Bernard Salt is founder and executive director of The Demographics Group. Data and mapping by data scientist Hari Hara Priya Kannan
More Coverage


Add your comment to this story
Wesfarmers kicks off $300m Bunnings property sale
A portfolio of six Bunnings Warehouses is up for sale just as institutions start to lock in retail property as a favourite asset class again.
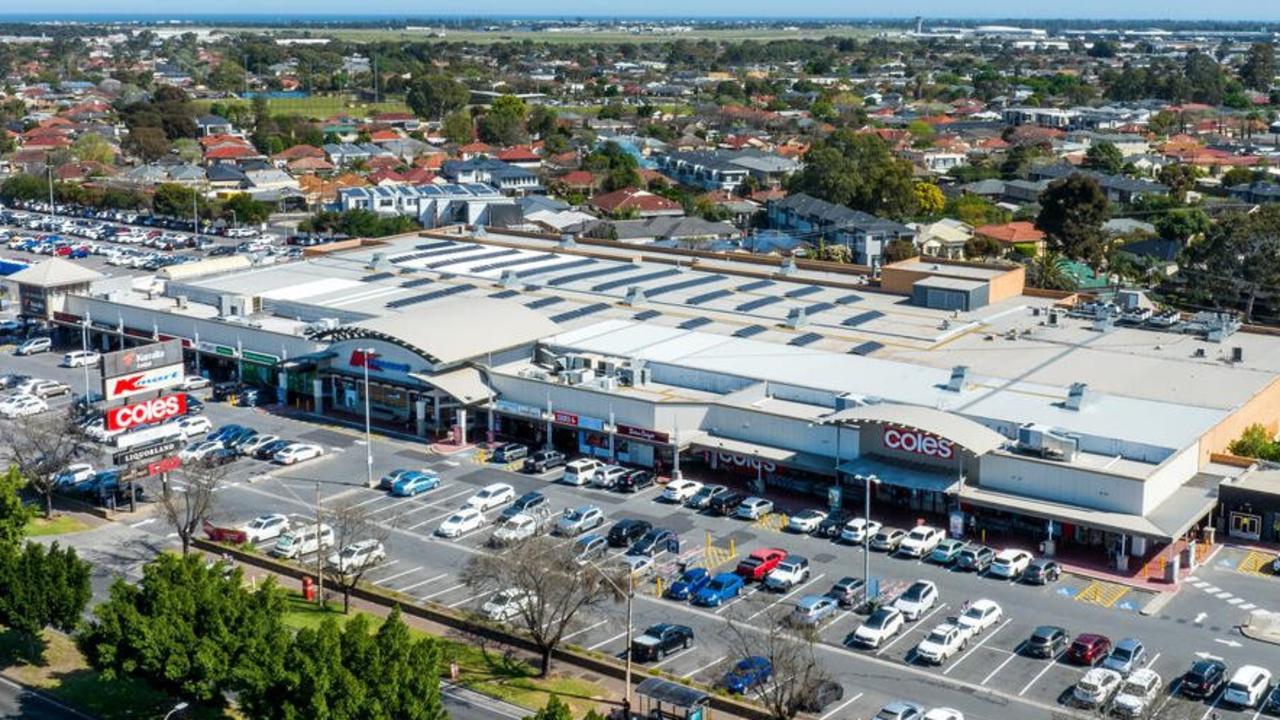
High-profile family’s shopping centre takeover – and big plans
Taplin Group is planning an expansion of the Kurralta Village shopping centre after paying $75.2m to take over the complex from supermarket giant Coles.
To join the conversation, please log in. Don't have an account? Register
Join the conversation, you are commenting as Logout