How property demand is shaped by one’s life cycle
The ‘spaghetti lines’ of the life cycle are on the move. It’s enough to reshape the underlying demand for residential property.


They rise and fall across the life cycle corralling us into and out of relationships and even shaping life’s later years. And yet we rarely see, let alone appreciate, the significance of these hidden, guiding, “tram tracks” of life.
I am of course referring to the twirling swirling spaghetti lines captured in the accompanying chart.
They show over the 2006 and 2016 censuses the times in the life cycle when collectively the Australian people commit to marriage, decide to divorce, and suffer the loss of a life partner through widowhood.
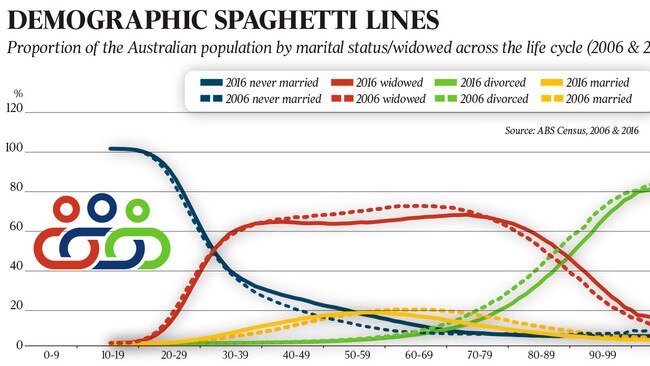
What this chart shows is the spaghetti lines are on the move. Not wildly, but enough to shape the underlying demand for residential and perhaps for some commercial property.
Indeed I argue this spaghetti-line chart should take pride of place upfront in the strategic plan of any Australian property or property-related business.
-
Marriage and commitment

Let’s start with marriage, including defacto relationships.
In 1971 the median age at first marriage for an Australian woman was 21 while for men it was 23.
Indeed it was common practice for a young woman to announce her engagement on her 21st birthday (and usually she would make her selection from the shallow pool of potential partners in her local area).
Today the average age at first marriage for an Australian woman is closer to 31 while for men is 32.
The average age at commitment has pushed out by a decade. Young couples have been postponing commitment to marriage by an average of five weeks every year for the last 50 years.
And the reason why is obvious enough. Australians now spend much of their 20s completing further education, securing technical training and/or gaining valuable work and life experience.
Life experience in this sense includes the concept of gap years and of working overseas.
And so the average (median) age at first confinement (babies) has pushed out over this time frame from the early 20s to the early 30s.
These shifts have transformed the market for residential property.
The 20s are now more likely to be spent in share houses and/or in rented apartments owned by investors and often located in the inner-city.
-
First-home market

The first-home market is now more likely to include inner-city residential apartments as well as bigger houses on the city’s edge.
And both partners are now more likely to be breadwinners both before and after kids arrive.
The proportion of the population in a committed couple relationship (includes defacto relationships) is captured by the census in a concept known as social marriage. This proportion accelerates in the late 20s before plateauing in the early 30s when kids typically arrive on the scene.

By the late 30s couples tend to have had one or two or more kids, they’ve had some success in the workforce, and as a consequence they’re looking to upgrade to family-friendly housing: three-four bedrooms, two bathrooms, front garden, backyard.
This is the upgrader market and I think it mostly applies to the 37-45 age group. It is this segment that will grow most rapidly over the next five years as the Millennial generation, a reverberation of the baby-boom, start tipping into their 40s.
There may be some Millennials who have the capacity to upgrade to bigger, schmicker apartments or indeed to ease into bigger properties in the inner- and middle-suburbs, but I think many (indeed most) will make other choices.
I suspect living in a chic minimalist apartment, with young kids, trying to manage a Zoom call would a sobering and life-influencing experience.
-
Millennials upgrade

In the immediate future I think we will see heightened demand for upgrader McMansion product on the city’s edge (the Zoom call has killed commuting) and/or in idyllic lifestyle locales within striking distance of capital-city workplaces.
However the social-marriage tram-track spaghetti-lines of life (see chart) show a dip in marital coupling in the early-40s caused by a consequential rise in separations and divorce.
Indeed, according to ABS publications, in 2019 there were 114,000 marriages in Australia and 49,000 divorces. It seems 42 per cent of marriages end in divorce.
The early 40s are no doubt exciting, even exhilarating, years in the typical Australian life cycle.
There’s the joyousness of having young kids. There is the excitement of promotions and opportunities in the workplace. And, as I recall, there is endless chitchat about renovations and extensions and upgrading digs.
It is said that you are likely to buy the most expensive house you’ll ever buy in your early 40s. And I’d have to agree that this is probably the case for most Australians.
At this stage in the life cycle household incomes are rising, more space is needed for a growing family, and there’s another 20 years in the workforce to repay debt. In some respects this is the sweet-spot in targeting potential buyers for family-orientated houses.
But some relationships don’t make it through these most challenging of years. New accommodation arrangements must be managed.
Periods of separation lead to demand for rental apartments in the inner-city or perhaps for townhouse accommodation in the suburbs to facilitate shared parenting.
-
New markets emerge

Access to divorce was problematic before new legislation was introduced in the late 1970s. Prior to this point the narrative of urban life was simple: teenagers Australians lived with their parents; some 20-somethings may have boarded with an elderly aunt who doubled as a kind of chaperone-in-the-city; then couples married and moved to the city’s edge.
All of this led to a homogeneity of suburbia over the period 1950-1980 which delivered three-bedroom family housing in ever-expanding garden suburbs.
The determination of young women to pursue further education and to remain in the workforce, the advent of couples postponing having kids from the 20s to the 30s, and acceptance of the fact not all relationships work out, diversified the market for Australian housing.
Add in the impact of foreign students (at scale from the mid-2000s onwards) and it’s self-evident our housing and accommodation requirements have been in transition for decades.
But underpinning all of this change is the ever-present spaghetti lines that rise and fall, and move, across the life cycle.
And which brings me to the final line in the attached chart, the so-called widow line (includes both men and women) which, over time, is pushing further to the right. This is due to increases in life expectancy and better healthcare.
But it also shows where there is a different housing need: that of a lifestyle village or, later, some form of care arrangement.
The purpose of publishing demographic spaghetti lines for 2016 and 2006 is to show that, like tectonic plates, they move incrementally over time.
-
Opportunity in gaps
My point is this: position your business in a space where the tectonic plates, the spaghetti lines, the tram tracks are widening and you will be rewarded with years — decades, perhaps — of an ever-expanding market built upon the surety of social change.
And by my reading of the chart, the rising markets are 40-something never-marrieds, the 60-something divorcees, the 70-something widowed singles.
I suspect when the 2021 Census results are released in November 2022 an update of this chart will show an upward bump in the 40-something married segment as many in the gay community happily, and rightfully, recorded their status as married at this year’s census.
What also strikes me about this chart is the gains that have been made in the life expectancy of couples in their 80s.
Perhaps aged-care and nursing home planning should include greater provision for older, loving (they have clearly stayed the distance), couples living life’s later years together, in care.
Property players commission research on price points, on buying intentions, on the bits and pieces buyers would like in their property-package purchase. And all of this of course is so very necessary in managing a home or apartment building business.
But perhaps sitting above all of this is the simple question of whether you’re in the right business segment, offering the right product, and this is where the spaghetti lines of the life cycle come into play.
Bernard Salt is executive director of The Demographics Group; research by Hari Hara Priya Kannan.


To join the conversation, please log in. Don't have an account? Register
Join the conversation, you are commenting as Logout