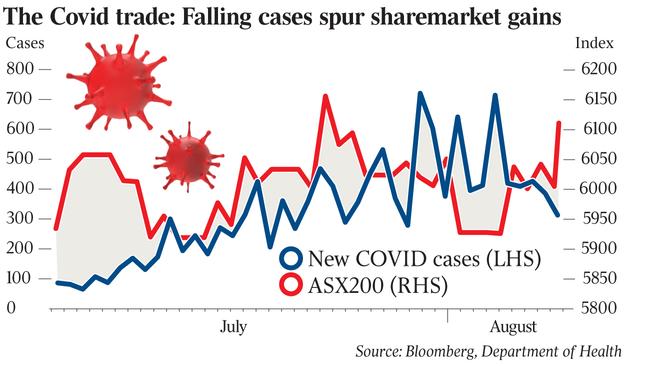
The corona count: Disease data drives stockmarket gyrations
Markets are getting a bounce when daily case numbers from Victoria’s second wave fall and shares seem to swoon when case numbers rise.

The COVID trade is well under way.
Markets on average are getting a bounce when daily case numbers from Victoria’s second wave fall and shares seem to swoon when case numbers rise.
Rising hope that Victoria may have had passed its peak of second wave coronavirus cases on Monday spurred on the benchmark S&P/ASX200 share index to its best one-day rise in three weeks. The benchmark added 1.8 per cent to 6110.20 points as the number of new cases of coronavirus in the COVID-hit state fell to a 12-day low of 322, despite 19 more deaths from the disease.
Early Tuesday the S&P/ASX 200 rose another 0.7 per cent to 6151 points after new cases in Victoria came in at 331 and the 7-day average of new cases hit a 12-day low of 451.
This followed the index dropping to a five-week low of 5860.7 points last week as Melbourne entered into its tough stage 4 mobility restrictions and daily case numbers were pushing 700.
Shares that suffered the most from Victoria’s worsening second wave of coronavirus in recent weeks were among the best performers on Monday.
Companies with Victorian-exposed earnings were among the best performers for a second day running after new cases in the state fell to 331 and the 7-day average of new cases hit a 12-day low of 451.
Webjet 4pc, Bendigo Bank and Qantas rose 2.5pc, Westpac and NAB rose 1.7pc, ANZ rose 1.6pc, CBA rose 1.2pc, and Crown Resorts gained 0.1pc surged.
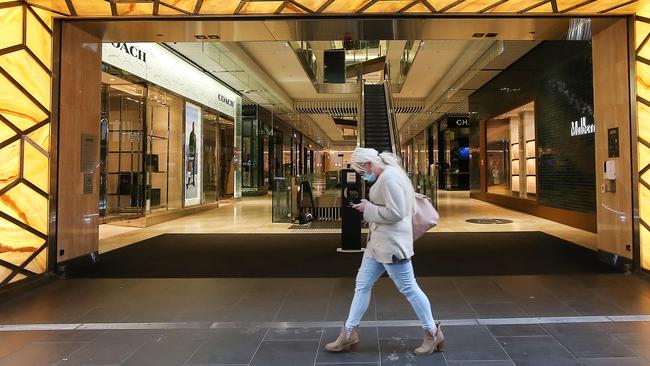
Along with broader travel stocks such as Flight Centre and Webjet, and retail barometer, the Chadstone mall part-owner Vicinity Centres, trading in the same basket of shares has been highly volatile on the Victorian numbers over recent weeks.
Among the bulge bracket investment banks, trading desks closely track the release of daily numbers and some quantitative analysts — usually better suited to calculating trends in share valuations — and top economists have built a franchise in recent months modelling coronavirus numbers for fund managers.
But Victoria's daily case numbers, which have regularly been leaked to the media sometimes hours before being made official, form the centre of a major trading window.
“The number of cases each day is a very important statistic, given its health and economic implications. So there has been some trading done on the back of the press leaks of the daily official coronavirus stats,” one veteran trader told The Australian.
It’s telling that markets data giant Bloomberg also has a coronavirus case variable that traders can track for each country.
Trends on the virus are “definitely more important than earnings results, which of course look in the rear-view mirror of a company's operations,” he added.
While wary of prematurely celebrating victory over coronavirus, traders were embracing recent signs that Victoria’s lockdowns are working and that new cases in NSW and Queensland are manageable.
Rising cases
“Victoria’s lockdown knocked the market last week and rising cases in the last two weeks didn’t help, but Monday’s fall to 322 cases shows the numbers are finally falling,” said Bell Potter head of institutional sales and trading Richard Coppleson.
“As that trend continues the market may grind higher, as some investors are now happy to look through the earnings carnage and look more at the reopening that will come.”
If so, coronavirus trends may be at least as important as the June half results.
Indeed, Victoria’s subsequent lockdown, which took place after June 30, means financial year profit results for many companies will be quite stale.
“I think the market is concluding that the second wave has peaked,” one institutional trader said. “Investors and traders are taking fresh long positions and some shorts are being covered.
“Of course there are still risks in Victoria and NSW and the rise in deaths is sad news, but the drop in cases indicates that the masks and lockdown is starting to work in Victoria.” Perpetual head of investment strategy Matt Sherwood noted that fluctuating numbers of tests for coronavirus have caused large intra-week swings in coronavirus cases.
The lowest number of tests typically occurs on Mondays and the highest numbers on Tuesdays.
But the number of cases recorded on any particular day has also been quite volatile, with both the lowest and highest changes in daily case numbers having occurred on a Monday.
“I would argue that the market appears to be questioning its downside risk scenarios around key sectors which have been exposed to the COVID disease,” Mr Sherwood told The Australian.
“The market might be giving the impression that the Victorian numbers are coming down, so therefore the lockdown is having the desired effect on disease spread, but I would be very hesitant at this stage to draw such a conclusion, for the simple fact that it’s just very early.”
He said there was day-to-day noise for R-nought factors (reproduction rates) for COVID-19.
“When you look at Australia’s numbers, they have been coming down for the past week, but that had followed what had been two or three weeks of pretty significant gains,” he said.
Mr Sherwood added that it was too early to say that Victoria had its second wave under control.
“There’s a constructive trend but the outbreaks are in many regions, with a lot of community spread.
“So I wouldn’t draw such a conclusion at this stage, but it has seen investors start to question the earnings dislocation they have priced into certain sectors, particularly the cyclical ones — such as financials and industrials — and stocks that have been the most affected by mobility restrictions.”
In his view, it takes “longer than a week or two” for coronavirus trends to solidify.
“You need to be looking at these reproduction rates, probably over the space of a month,” he said.
“One month ago, the rate for Australia was 2, now it’s 1.15, but three days ago it was 1.03”.
“So it’s a noisy series and really the important thing here is learning how to interpret the data”.
“At the moment, America’s coronavirus R-nought value is below 1 and falling … In contrast, Europe is going up.”
More Coverage


Add your comment to this story

The risk posed to shares by a ‘hung’ federal parliament
Investors are taking a wait-and-see approach to the federal election on May 3 but a close result or even a minority parliament formed with the help of independents would not go down well.

‘Unfair’: Vic family business to lose $2m-plus on Trump call
The real cost of tariffs are coming to light, as businesses such as Richard Davies’ face uncertain futures amid escalating trade tensions.
To join the conversation, please log in. Don't have an account? Register
Join the conversation, you are commenting as Logout