
Map reveals how Australia’s voting preferences has changed
A new map shows the change in how Australians have voted over 15 years — and it’s not good news for the country’s major parties.

Federal Election
Don't miss out on the headlines from Federal Election. Followed categories will be added to My News.
Australians are increasingly shifting their support away from the major parties — particularly in regional areas — with a map revealing the change in how people voted between 2004 and 2019.
In general, both Labor and the Coalition have gone backwards when it comes to first preference votes.
Data from News Corp shows the Coalition secured 4.5 million votes in 2004 when John Howard won his third term as prime minister against then-Labor leader Mark Latham.
Maps show support for the Liberals, Nationals and CLP – The Territory Party, once extended far into regional areas of Queensland and New South Wales.
The Coalition racked up around 46 per cent of the vote in 2004, but by 2019 this had dropped to 41 per cent (4.9 million votes), with maps showing support retreating from remote areas in particular.
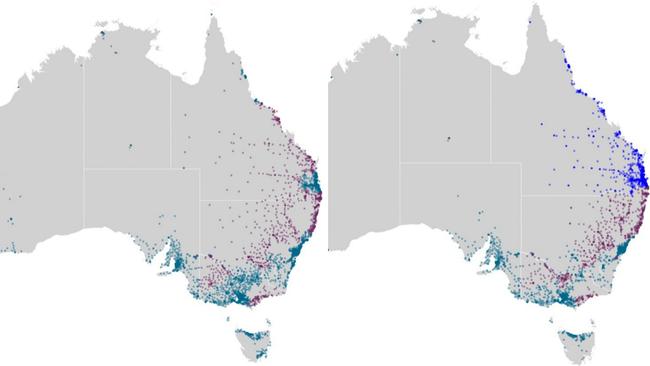
It was a similar story for Labor, which got 3.7 million votes in 2004, equivalent to 38 per cent of the vote in the 2004 election.
Fast forward 15 years and Labor’s support dropped to 34 per cent in 2019 (4 million votes) — when it was again beaten, this time by Scott Morrison.
The party’s vote appears to have shrunk in populated areas along the east coast of NSW and in Victoria.
The decline in votes is also hitting the parties where it hurts — the number of seats won.
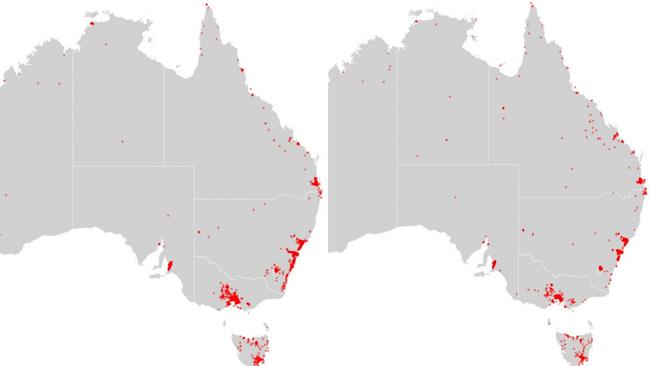
At the last federal election, the Coalition took office with 77 seats out of the 151 up for grabs. This is much less than the 87 seats it got in 2004, especially as there were only 150 seats in parliament that year.
Meanwhile Labor only won 68 seats in 2019, only slightly up from 60 seats in 2004.
The erosion in seats for the major parties has flowed to other smaller parties and independents. In 2004, three independents managed to gain a seat in parliament but by 2019, six candidates who were not members of the major parties had been elected.
The Greens has been successful in getting one MP into parliament, and its first preference vote has climbed from 7 per cent, to 10 per cent.
Many other independents and micro parties have also emerged and are clamouring for people’s vote including Katter’s Australian Party and Clive Palmer’s United Australia Party.
In fact the proportion of people voting for other parties outside of Labor, the Coalition or The Greens increased from 8 per cent, to 15 per cent in 2019.
Independents have also managed to increase their vote from to 2 per cent to 3 per cent, while One Nation has gone from 1 per cent to 3 per cent.
Originally published as Map reveals how Australia’s voting preferences has changed
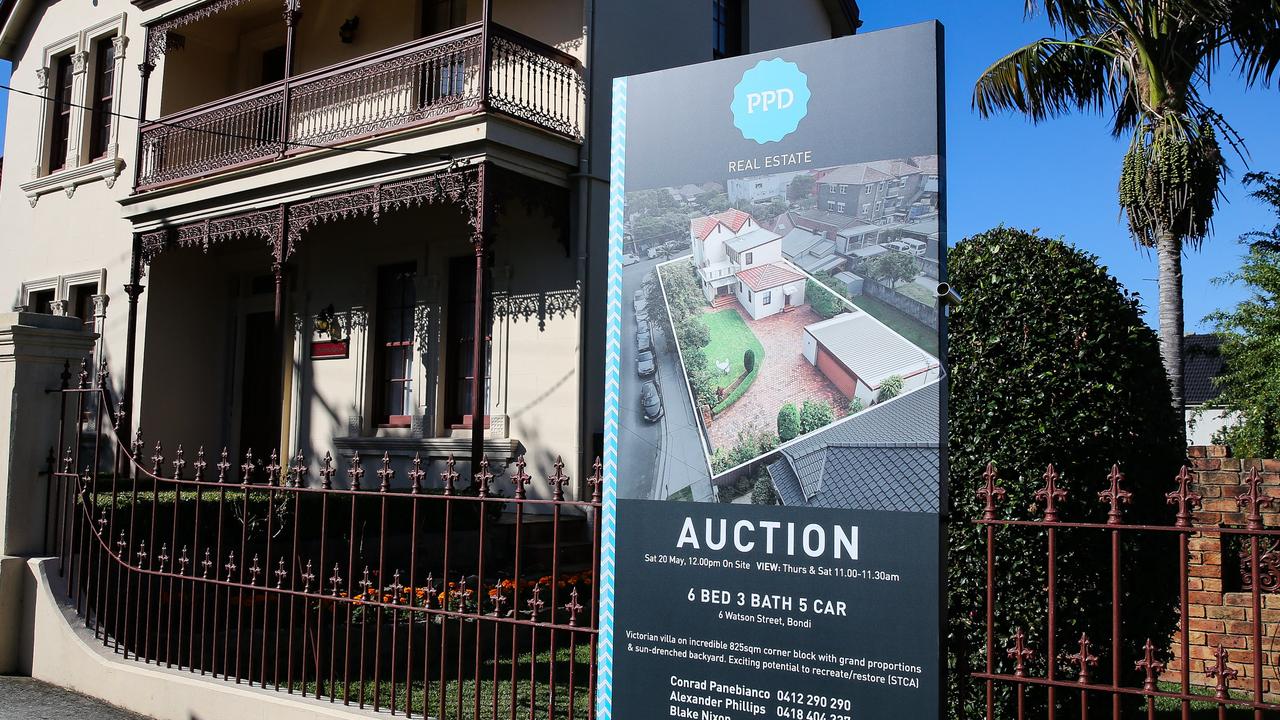
‘Bad tax’: Big call on stamp duty
The federal housing minister is signalling a major change that could affect millions of property owners.

Big business weighs in on housing crisis
A powerful business lobby is calling for major reforms to fix the country’s housing crisis.