Mobility data shows Sydney one of world’s most locked down cities
Sydney’s lockdown is derided by some, but a wealth of new data has shown that the city is right now one of the most restricted on earth.
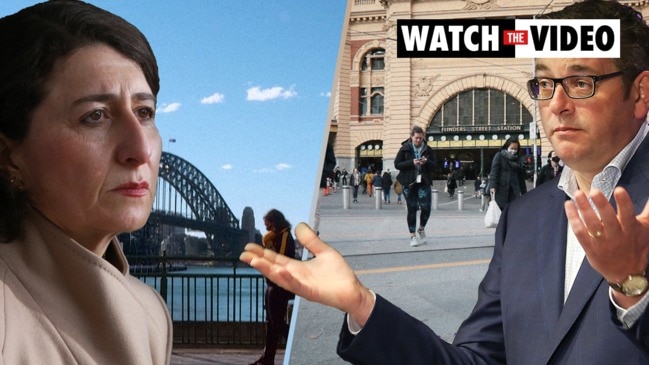
Sydney may be derided by some as going through “lockdown lite” but according to new mobility data, it could just been the most locked down city on the planet right now.
Nonetheless, Sydney isn’t quite as stationary as Melbourne was during its lockdowns.
Australia’s largest city is currently in the midst of ongoing restrictions after community transmission of Covid-19 was identified, mainly affecting the city’s east and south west.
On Thursday, NSW Premier Gladys Berejiklian confirmed a further 65 cases had been identified with 28 of those people in the community at some point during their infectious period. There have now been more than 800 covid transmissions in a month.
Those people living in the Greater Sydney region – bounded by the Illawarra, Blue Mountains and Central Coast – have only four reasons to leave home and even then can only venture up to 10km away. Pubs, restaurants, salons, cinemas, gyms and the like are closed and people should only work outside the home if it is essential.
However, unlike in some other state lockdowns, what constitutes essential work or essential shopping has not been spelled out in NSW.
Even so, movement in Sydney has dropped off a ledge.
Transport app Citymapper has judged Sydney to be the least mobile of the 36 major world cities it measures. Mobility is down almost 90 per cent on pre-pandemic levels since the initial restrictions came in almost three weeks ago.
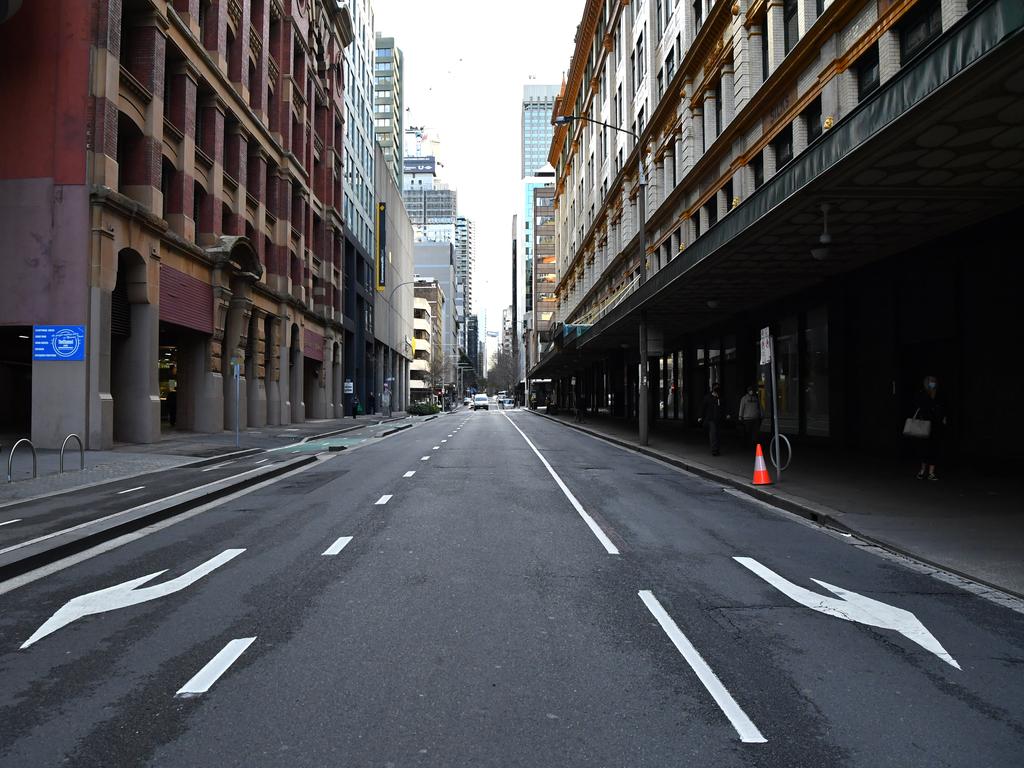
Almost 90 per cent fewer trips in Sydney
Citymapper allows users to plan journeys on public transport, cabs or ride share services and also by walking. Its mobility index is based on the number of trips researched on the app.
Twelve weeks ago in late April, when Sydney had no restrictions in place, the city’s mobility was at 50 per cent compared to the baseline of January 2020 before Covid-19 touched Australia’s shores.
On Wednesday, of the 36 cities measured, Sydney was the least active sitting at just 12 per cent mobility, 88 per cent down from usual.
The second least mobile city was Seoul, which is going through its own Covid woes, at 20 per cent.
In contrast, Istanbul, Turkey’s largest city, and Paris were both at 88 per cent movement compared to pre-Covid.
The British cities of Birmingham and Manchester were above 80 per cent mobility just days before the UK does away with most coronavirus restrictions.
RELATED: The two different Sydneys in lockdown
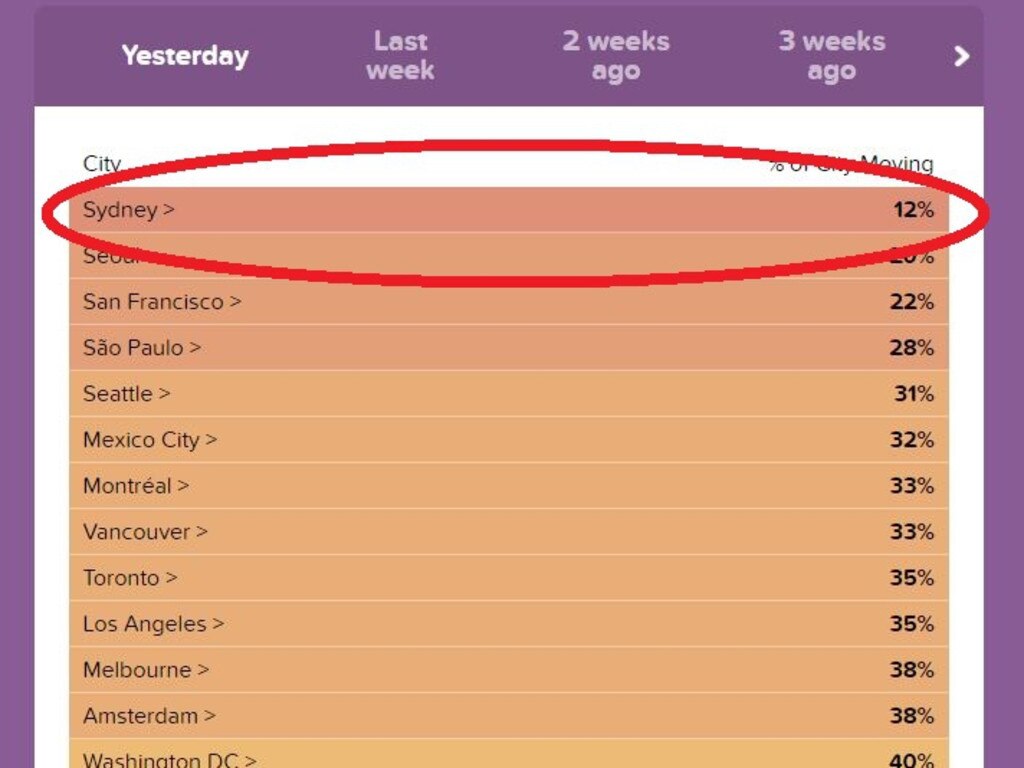
Sydney’s top of list of world’s least mobile metropolises
According to the Citymapper index, the most locked down cities in the world right now – aside from Sydney and Seoul – are San Francisco, Sao Paulo, Seattle, Mexico City, Montreal and Vancouver. All have less than one third of the standard amount of people out and about.
Other data has also emerged showing drops in activity in Sydney.
According to the Google community mobility report for the week ending July 11 – which was before stricter restrictions came in such as the 10km rule – trips to cafes, shopping centres and similar were down by 46 per cent in NSW; supermarkets and pharmacies were down by 16 per cent and public transport by 70 per cent.
Despite images of Sydneysiders thronging open spaces, trips to parks were down by 31 per cent.
However, all those figures were for the entire state as a whole rather than just Greater Sydney.
Looking at individual local government areas, Ryde on Sydney’s north shore, for instance, saw trips to the shops go down by 62 per cent and public transport by almost 80 per cent.
In Waverley, where Bondi is located, retail trips were down 70 per cent and transport by almost 80 per cent, while fresh air jaunts to parks were down almost two thirds.
Data from research firm Roy Morgan has shown that trips to Sydney’s CBD had plummeted to just 11 per cent by early July compared to before the pandemic.
That’s the lowest it has ever been and the same as Melbourne CBD’s lowest point which was reached in late August 2020.
“The recent lockdowns have sent the movement of people in the CBDs plunging to record lows,” said Roy Morgan chief executive officer Michele Levine.
“These are all lower levels of movement than reached during any stage of the nationwide lockdown in the first half of 2020.”
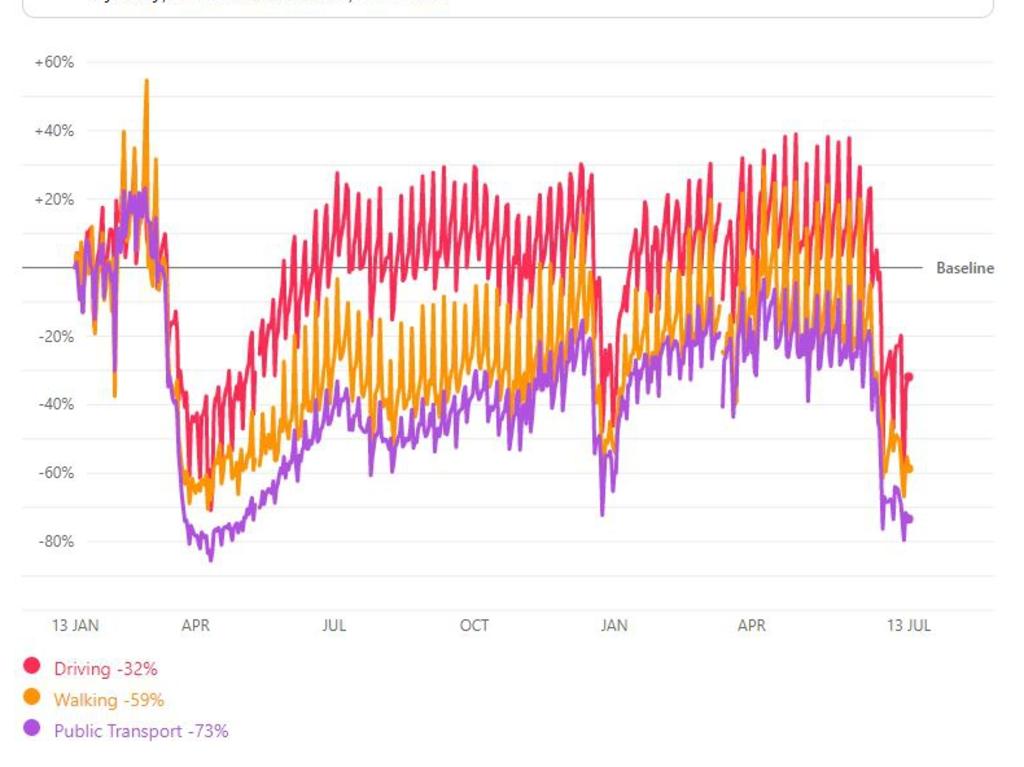
Driving also reduced
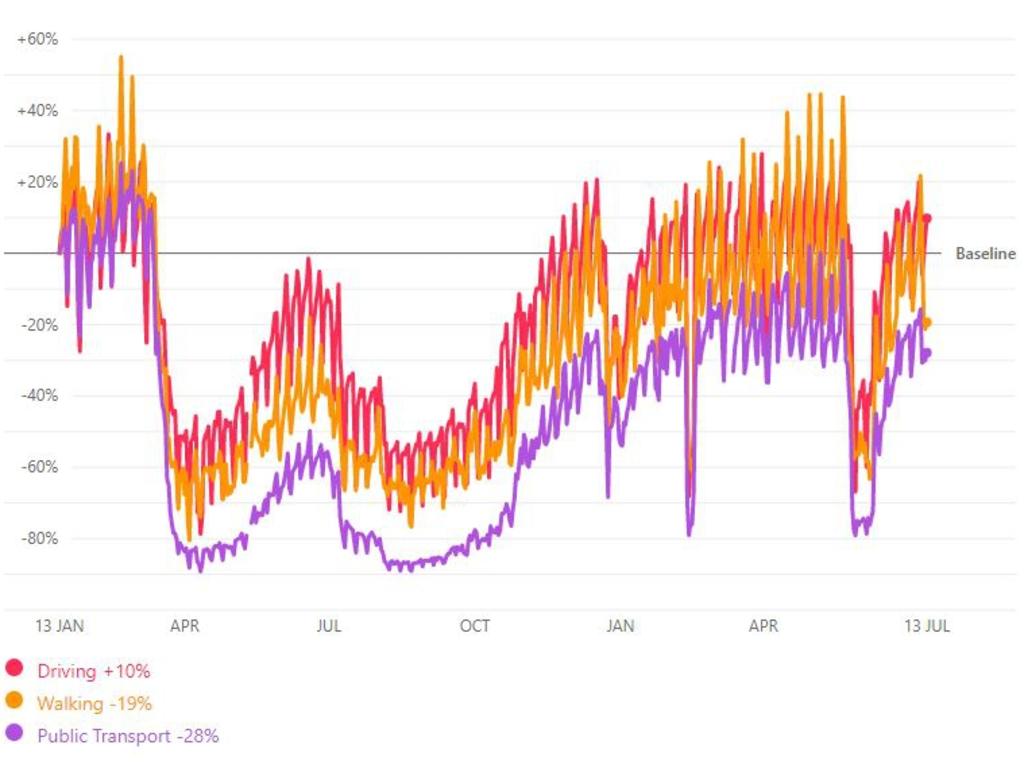
Then there is Apple’s mobility data which is compiled from requests for directions on its maps software on phones and computers.
Unlike Citymapper, it covers driving as well as walking and transport.
It found public transport usage in Sydney was now sitting at around 80 per cent lower than the baseline. This is lower than at any other time with the exception of April 2020 when it dipped to around 85 per cent.
Driving was 32 per cent down on Wednesday but has been below 55 per cent in previous days. The numbers are higher than for buses, trains and trams reflecting a preference for some to use their cars over public transport during lockdowns.
RELATED: Victoria’s lockdown rules explained
Melbourne still does it better – slightly
Melbourne just edges out Sydney in the lockdown stakes though. According to Apple, public transport usage dropped 80 per cent in Melbourne during the May/June lockdown and by almost 90 per cent during spells in the mammoth 2020 winter restrictions.
Just like in Sydney, road traffic wasn’t as affected as public transport in Melbourne with roads busier than trams and buses. In June, there were 60 per cent fewer cars on Melbourne’s roads on some days and 70 per cent at times in August last year.
And in the Citymapper mobility index, during Melbourne’s June lockdown movement went down to just 10 per cent during the week, ending 6 June. That's a couple of basis points less than Sydney now.
For all the “mockdown” jibes, Sydney appears to be only slightly busier than Melbourne during lockdown which also had a curfew, a 5km limit and more shops shut.
Mobility is set to plummet once again in Melbourne once again as the city enters its fifth lockdown.
It will be notable to see how movement drops in Melbourne and if it crashes by more than that currently seen in Sydney.


